Financials
Financial Statements And Related Announcement - Half Yearly Results
Financials Archive![]() Note: Files are in Adobe (PDF) format.
Note: Files are in Adobe (PDF) format.
Please download the free Adobe Acrobat Reader to view these documents.
Income Statement
Statements Of Financial Position
Review of Performance
Our Business
OKP Holdings Limited is a home-grown infrastructure and civil engineering company in the region. It specialises in the construction of urban infrastructure, expressways, vehicular bridges, flyovers, airport infrastructure and oil and gas-related infrastructure for petrochemical plants and oil storage terminals as well as the maintenance of roads and roads-related facilities and building construction-related works. We tender for both public and private civil engineering and infrastructure construction projects. We have expanded our core business to include property development and investment.
We have three business segments: Construction, Maintenance and Rental income from investment properties.
Review of income statements for the Half Year ended 30 June 2025
Revenue
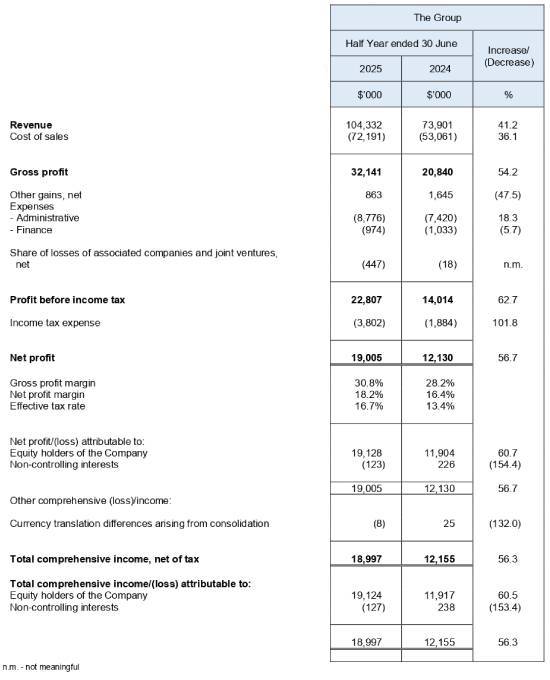
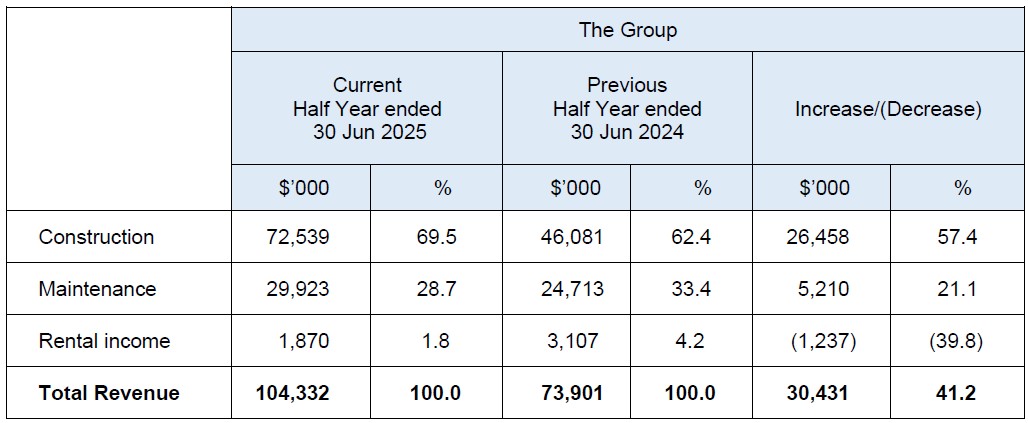
Our Group reported a 41.2% or $30.4 million increase in revenue to $104.3 million during the first half year ended 30 June 2025 ("1H2025") as compared to $73.9 million during the first half year ended 30 June 2024 ("1H2024"). The improvement was mainly due to the 57.4% increase in revenue from the construction segment to $72.5 million and a 21.1% increase in revenue from the maintenance segment to $29.9 million, partially offset by a 39.8% decrease in rental income.
Both the construction and maintenance segments exhibited positive revenue growth in 1H2025 as compared to 1H2024. The growth was primarily driven by a higher percentage of revenue recognised from various ongoing and newly awarded construction projects as they progressed to a more active phase in 1H2025.
The decrease in rental income was mainly due to ongoing major renovations at the property located at 6-8 Bennett Street, East Perth, Western Australia and the transition period following tenant departures during the last financial year. These upgrades are expected to enhance the property's longterm value and future rental returns.
Both the construction and maintenance segments continue to be the major contributors to our Group's revenue. On a segmental basis, construction, maintenance and rental income accounted for 69.5% (1H2024: 62.4%), 28.7% (1H2024: 33.4%) and 1.8% (1H2024: 4.2%) of our Group's revenue, respectively, for 1H2025.
Cost of sales
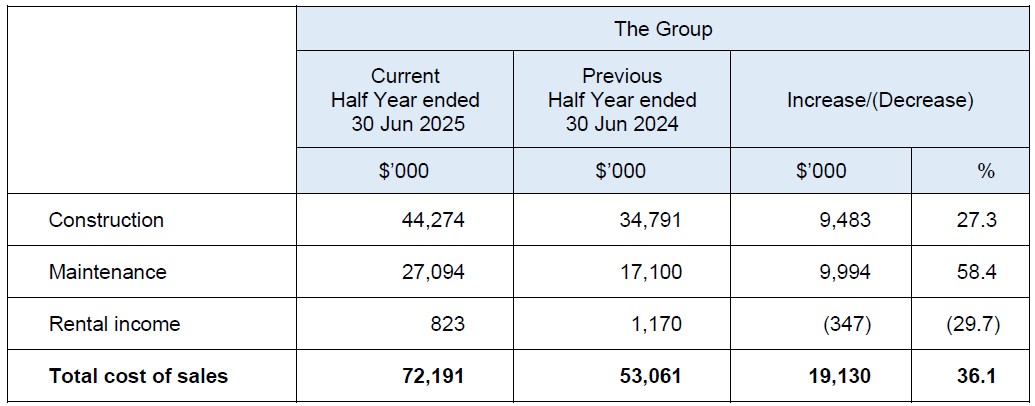
Our cost of sales increased by 36.1% or $19.1 million from $53.1 million for 1H2024 to $72.2 million for 1H2025. The increase in cost of sales, comprising sub-contracting costs, cost of construction materials, overheads and labour cost, was in line with the increase in business activities, during 1H2025.
Gross profit and gross profit margin
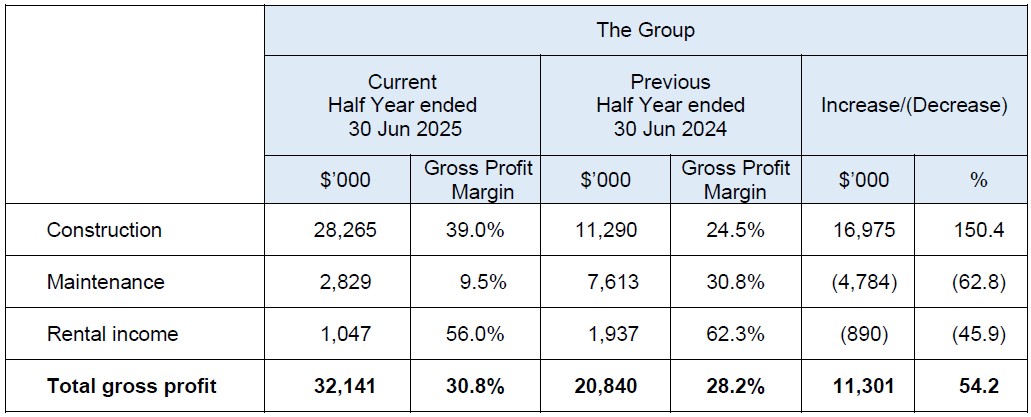
Overall, our gross profit for 1H2025 increased by 54.2% or $11.3 million from $20.8 million for 1H2024 to $32.1 million for 1H2025.
The construction segment exhibited a substantial increase of $17.0 million in gross profit, from $11.3 million in 1H2024 to $28.3 million in 1H2025. The increase in gross profit from the construction segment was partially offset by (1) a decrease in gross profit of $4.8 million from the maintenance segment, reducing from $7.6 million in 1H2024 to $2.8 million in 1H2025, and (2) a decrease in gross profit of $0.9 million from the rental income segment, reducing from $1.9 million in 1H2024 to $1.0 million in 1H2025.
For the construction segment, the gross profit margin increased from 24.5% in 1H2024 to 39.0% in 1H2025, largely attributable to the higher contributions from several projects which had commanded better gross profit margins during 1H2025. The decrease in the gross profit margin for the maintenance segment from 30.8% in 1H2024 to 9.5% in 1H2025 was mainly due to lower profit margins for current maintenance projects as a result of a more competitive pricing environment.
Other gains, net
Other gains decreased by $0.7 million or 47.5%, from $1.6 million for 1H2024 to $0.9 million for 1H2025. The decrease was mainly due to:
- a decrease of $0.1 million in gain on disposal of fixed assets; and
- an increase of $0.6 million in the loss on foreign exchange arising from the revaluation of assets and liabilities denominated in Australian Dollars to Singapore Dollars
during 1H2025.
Administrative expenses
Administrative expenses increased by $1.4 million or 18.8% from $7.4 million for 1H2024 to $8.8 million for 1H2025. The increase was largely due to:
- an increase of $1.4 million in directors' remuneration (including profit sharing accrued) reflecting the higher profit generated by the Group; and
- an increase of $0.2 million in employee compensation due to salary adjustment and higher provision for bonus,
which were partially offset by:
- a decrease of $0.1 million in depreciation of property, plant and equipment; and
- a decrease of $0.1 million in repair and maintenance of office equipment,
during 1H2025.
Finance expenses
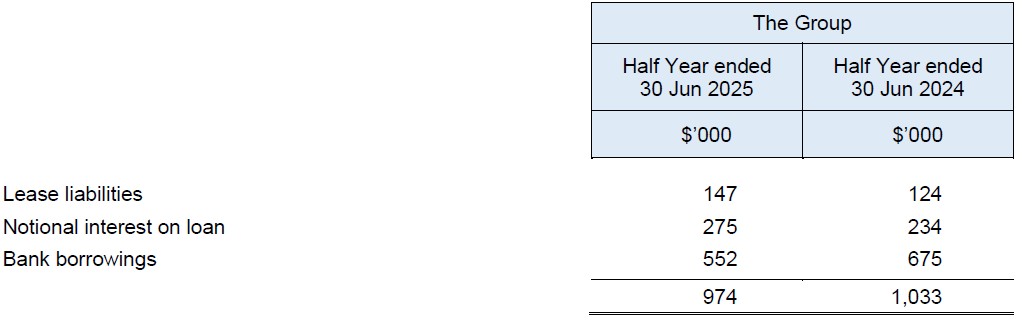
Finance expenses remained consistent at $1.0 million for both 1H2024 and 1H2025, due to the stable interest rates across the periods and there were no new major financing facilities within the Group.
Share of results of associated companies and joint ventures
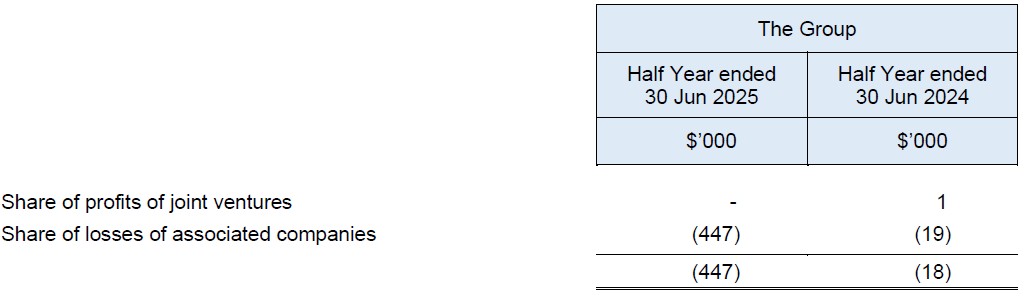
The share of losses of associated companies and joint ventures increased by $0.4 million or 2,383.3% in 1H2025. The increase was mainly due to an adjustment made on the Group's share of losses from its 22.5%-held associated company, Chong Kuo Development Pte Ltd.
Profit before income tax
Profit before income tax increased by $8.8 million or 62.7%, from $14.0 million for 1H2024 to $22.8 million for 1H2025. The increase was due mainly to (1) the increase in gross profit of $11.3 million which was partially offset by (2) the decrease in other gains (net) of $0.8 million, (3) the increase in administrative expenses of $1.3 million, and (4) the increase in share of losses of associated companies and joint ventures of $0.4 million, as explained above.
Income tax expense
Income tax expense was mainly in relation to the operating profits registered by the profitable entities within the Group. The increase of income tax expense by 101.8% or $1.9 million in 1H2025 is due mainly to higher taxable profit registered by the Group.
The effective tax rate for 1H2025 and 1H2024 was 16.7% and 13.4% respectively, which was lower than the statutory tax rate of 17%, due to the utilisation of tax credits in both 1H2025 and 1H2024.
Non-controlling interests
Non-controlling interests of $0.1 million was due to the share of losses of our subsidiary corporation, Raffles Prestige Capital Pte Ltd, in 1H2025.
Net profit
Overall, net profit increased by $6.9 million or 56.7%, from $12.1 million for 1H2024 to $19.0 million for 1H2025, following the increase in profit before income tax of $8.8 million offset by the decrease in income tax expense of $1.9 million, as explained above.
Our net profit margin increased from 16.4% for 1H2024 to 18.2% for 1H2025.
Review of the financial position for the half year ended 30 June 2025
Current assets
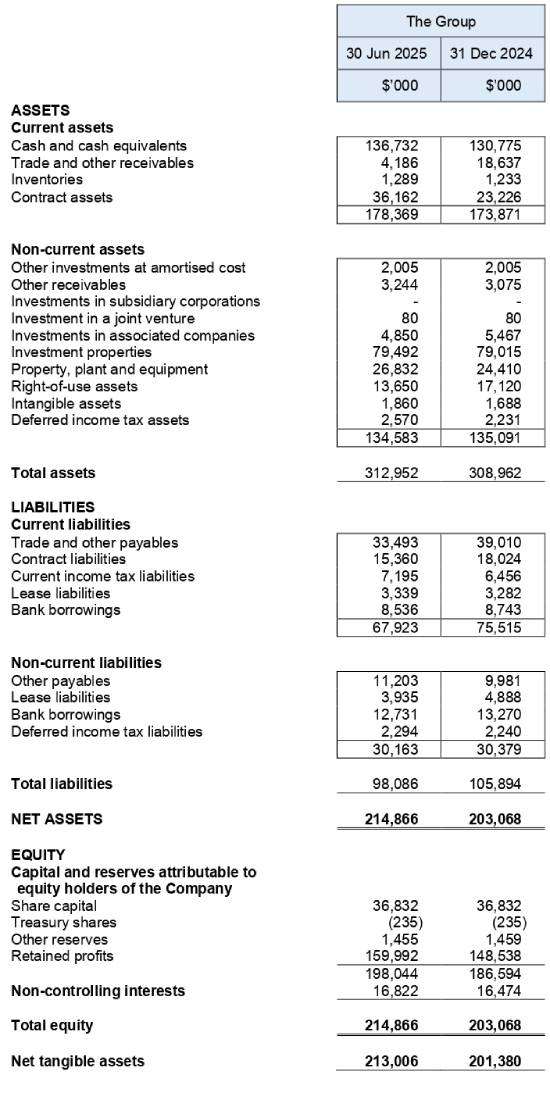
Current assets increased by $4.5 million, from $173.9 million as at 31 December 2024 to $178.4 million as at 30 June 2025. The increase was due mainly to:
- a $6.0 million boost in cash and cash equivalents, mainly due to $17.5 million
generated from operating activities, alongside $3.1 million in cash used in investing
activities, $7.7 million in cash used in financing activities and a decrease of $0.7
million in pledged deposits;
- an increase in contract assets of $12.9 million, primarily driven by the timing
difference between revenue recognised and billings for the on-going construction
and maintenance projects,
- a decrease in trade and other receivables of $14.4 million as a result of prompt
payments received from on-going construction and maintenance projects,
Non-current assets
Non-current assets decreased by $0.5 million, from $135.1 million as at 31 December 2024 to $134.6 million as at 30 June 2025. The decrease was due mainly to:
- a decrease in investments in associated companies by $0.6 million arising from
the share of losses and amortisation of notional fair value of loan of an associated
company; and
- a decrease in right-of-use assets by $3.4 million resulting from depreciation, no
new purchase of plant and equipment, and reclassification of right-of-use assets
to property, plant and equipment upon full repayment of lease liabilities,
- an increase in investment properties by $0.5 million resulting from structural
improvement and a foreign exchange realignment relating to the property at 6-8
Bennett Street, East Perth, Western Australia due to the revaluation of Australian
Dollars to Singapore Dollars;
- an increase in property, plant and equipment by $2.4 million resulting mainly from
the purchase of property, plant and equipment and reclassification of right-of-use
assets to property, plant and equipment upon full repayment of lease liabilities;
- an increase in intangible assets by $0.2 million;
- an increase in other receivables by $0.1 million due to amortisation of notional fair
value from the loan extended to an associated company, USB Holdings Pte Ltd;
and
- an increase in deferred income tax assets by $0.3 million,
Current liabilities
Current liabilities decreased by $7.6 million, from $75.5 million as at 31 December 2024 to $67.9 million as at 30 June 2025. The decrease was due mainly to:
- a decrease in trade and other payables of $5.5 million arising from the decrease of
trade payables of $0.1 million and decrease of $5.6 million in accrued operating
expenses, offset against the increase of $0.2 million in other payables
- a decrease of $2.6 million in contract liabilities due to reduced advance billings for
three construction projects for which obligations have yet to be fulfilled; and
- a decrease in bank borrowings of $0.2 million following repayment of bank
borrowings,
- an increase in current income tax liabilities by $0.7 million due to higher tax
provision provided for profitable entities within the Group,
Non-current liabilities
Non-current liabilities decreased by $0.2 million, from $30.4 million as at 31 December 2024 to $30.2 million as at 30 June 2025. The decrease was primarily due to:
- adecrease in bank borrowings of $0.5 million and a decrease in lease liabilities of
$1.0 million, resulting from the repayment of bank facilities,
- an increase in non-trade payables by $1.2 million due to advances of $1.5 million
extended by non-controlling interest, adjusted for a foreign exchange impact of $0.1
million and the amortisation of notional fair value of $0.2 million; and
- an increase in deferred income tax liabilities of $0.1 million,
Shareholders' equity
Shareholders' equity, comprising share capital, treasury shares, other reserves, retained profits and non-controlling interests, increased by $11.8 million, from $203.1 million as at 31 December 2024 to $214.9 million as at 30 June 2025. The increase was due mainly to:
- the profits generated from operations of $19.1 million attributable to equity holders
of the Company and non-controlling interests of $0.4 million arising from fair value
adjustment on interest-free loan for Raffles Prestige Capital Pte Ltd,
- the dividend payment to shareholders of $7.7 million,
Review of cash flows for the half year ended 30 June 2025
Net cash provided by operating activities
Our Group reported net cash generated from operating activities of $17.5 million in 1H2025, which was mainly due to cash generated from operating activities before working capital changes of $26.4 million and interest received of $1.2 million, which were partially offset by net working capital outflow of $6.7 million and income tax paid of $3.4 million.
Net cash used in investing activities
In 1H2025, our Group reported net cash used in investing activities of $3.1 million, which was mainly due to payments for (i) purchase of property, plant and equipment and right-of-use assets of $1.1 million and $1.5 million respectively, (ii) addition of intangible assets of $0.2 million, (iii) structural improvements of $0.8 million that were capitalised into investment properties, partially offset by (iv) proceeds received from disposal of property, plant and equipment and right-of-use asset of $0.1 million and $0.4 million respectively.
Net cash used in financing activities
Net cash used in financing activities of $7.7 million in 1H2025 was mainly attributable to (i) repayment of lease liabilities of $0.9 million, (ii) interest paid of $0.7 million, (iii) repayment of borrowings of $0.6 million, and (iv) dividend paid of $7.7 million, partially offset by (v) advance received from a non-controlling shareholder of $1.5 million and (vi) bank deposit pledged of $0.7 million.
Overall, free cash and cash equivalents stood at $131.0 million as at 30 June 2025, an increase of $6.7 million from $124.3 million as at 31 December 2024. This works out to cash of 42.7 cents per share as at 30 June 2025 as compared to 40.5 cents per share as at 31 December 2024 (based on 306,961,494 issued shares (excluding treasury shares) as at 30 June 2025 and 31 December 2024).
Commentary
Economic Outlook
Based on advance estimates by the Ministry of Trade and Industry ("MTI") on 14 July 2025, the Singapore's economy grew by 4.3% on a year-on-year basis, faster than the 4.1% growth in the first quarter of the year. Still, MTI highlighted that significant uncertainty and downside risks remain in the global economy in the second half of the year, given the lack of clarity over the United States' tariff policies. Earlier in April 2025, MTI had downgraded Singapore's gross domestic product growth forecast range for 2025 to between "0.0 to 2.0%", from "1.0 to 3.0%" previously.
In line with growing concerns over the impact of heightened trade tensions and volatility, MAS had loosened monetary policy for two consecutive quarters, with the latest easing in April 2025. At the July quarterly policy meeting, MAS left its monetary policy settings unchanged. Core inflation and CPI-All items inflation are forecasted to average 0.5 - 1.5%, reflecting modest imported and domestic cost pressures, as well as weak consumer spending in certain CPI components.
Industry Outlook
According to MTI, the construction sector expanded by 4.9% year-on-year in the second quarter, easing slightly from the 5.1% growth in the preceding quarter. Growth during the quarter was supported by an increase in public sector construction output. On a quarter-on-quarter seasonallyadjusted basis, the sector posted growth of 4.4%, reversing the 1.8% contraction in the previous quarter.
For 2025, the Building and Construction Authority ("BCA") projects the total value of construction contracts to be awarded to range between S$47 billion and S$53 billion. This is higher than the estimated S$44.2 billion in contracts awarded in 2024.
The strong demand in construction services is underpinned by the expected award of contracts for several large-scale developments, such as Changi Airport Terminal 5 ("T5") and the expansion of the Marina Bay Sands Integrated Resort. High-specification industrial buildings, educational developments, healthcare facilities, as well as mechanical and engineering contracts for rail lines are also expected to contribute to the increased demand.
Over the medium-term, BCA expects the total construction demand to reach an average of between S$39 billion and S$46 billion per year from 2026 to 2029. This will continue to be supported by developments including MRT projects such as the Cross Island Line (Phase 3) and the Downtown Line Extension to Sungei Kadut, and a steady pipeline of public housing developments. Overall industry demand could moderate in the medium term after the completion of the construction of T5. To tap the growth opportunities, the government is encouraging collaborative contracting that facilitates deeper collaborations amongst developers, consultants and builders.
The Group will continue to remain agile and stay abreast of policy changes and new requirements. By embedding compliance and adopting best practices, the Group ensures strict adherence to legislative and regulatory requirements, strengthening its operational resilience while maintaining a competitive edge.
Company Outlook and Order Book Update
Looking ahead, the Group is cognisant of the headwinds facing the global economy, given heightened trade tensions resulting in disruptions to supply chains and geopolitical risks.
Nevertheless, the Group remains focused in building a sustainable and resilient business to navigate challenges effectively.
Supported by a healthy pipeline of construction projects in Singapore and extensive experience as a contractor, especially for public sector projects, the Group is actively pursuing civil engineering and infrastructure projects in Singapore to strengthen its order book. The Group will also continue to prioritise strong project execution by ensuring timely and cost-effective delivery while exercising financial prudence and disciplined cashflow management.
In May 2025, the Group announced the award of a S$258.3 million contract from the Land Transport Authority for the construction of new cycling paths for East Region in Singapore across 11 towns. As of 30 June 2025, the Group's order book stood at $648.3 million, with projects extending till 2031.
On the property development front, the Group's residential project in Bukit Panjang, Phoenix Residences, comprising 74 units, has been fully sold. The project attained its TOP in January 2025 and received its Certificate of Statutory Completion ("CSC") from the Building and Construction Authority on 6 August 2025.
For its property investment business, the Group's investment property situated at 6-8 Bennett Street in Perth, Australia, continues to generate a positive stream of recurring rental income.
To further strengthen recurring income, the Group holds a portfolio of investment properties. These include a freehold, three-storey shophouse situated at 35 Kreta Ayer Road, and two adjoining freehold two-storey conservation shophouses located at 69 and 71 Kampong Bahru Road. These properties, held through its 51%-owned subsidiary, Raffles Prestige Capital Pte. Ltd., continue to generate a steady stream of recurring rental income, contributing positively towards the Group's performance.
Backed by a strong track record and decades of industry expertise, OKP remains committed to its long-term strategy of diversifying earnings and building on its portfolio of recurring income stream. The Group will continue to explore strategic partnerships to strengthen its foothold in property development and investment ventures while maintaining product and service excellence. These position the Group for sustainable growth while maintaining its competitive edge in the industry.