
Financials
Financial Statements And Related Announcement - Full Yearly Results
Financials Archive![]() Note: Files are in Adobe (PDF) format.
Note: Files are in Adobe (PDF) format.
Please download the free Adobe Acrobat Reader to view these documents.
Income Statement
Statements Of Financial Position
Review of Performance
Our Business
OKP Holdings Limited is a home-grown infrastructure and civil engineering company in the region. It specialises in the construction of urban and arterial roads, expressways, vehicular bridges, flyovers, commuter infrastructure, airport infrastructure, and oil and gas-related infrastructure for petrochemical plants and oil storage terminals as well as the maintenance of roads and roads-related facilities and building construction-related works. We tender for both public and private civil engineering and infrastructure construction projects. We have expanded our core business to include property development and investment.
We have three business segments: Construction, Maintenance and Rental income from investment properties.
Income Statement Review (Current Financial Year ended 31 December 2025 vs Previous Financial Year ended 31 December 2024)
Revenue
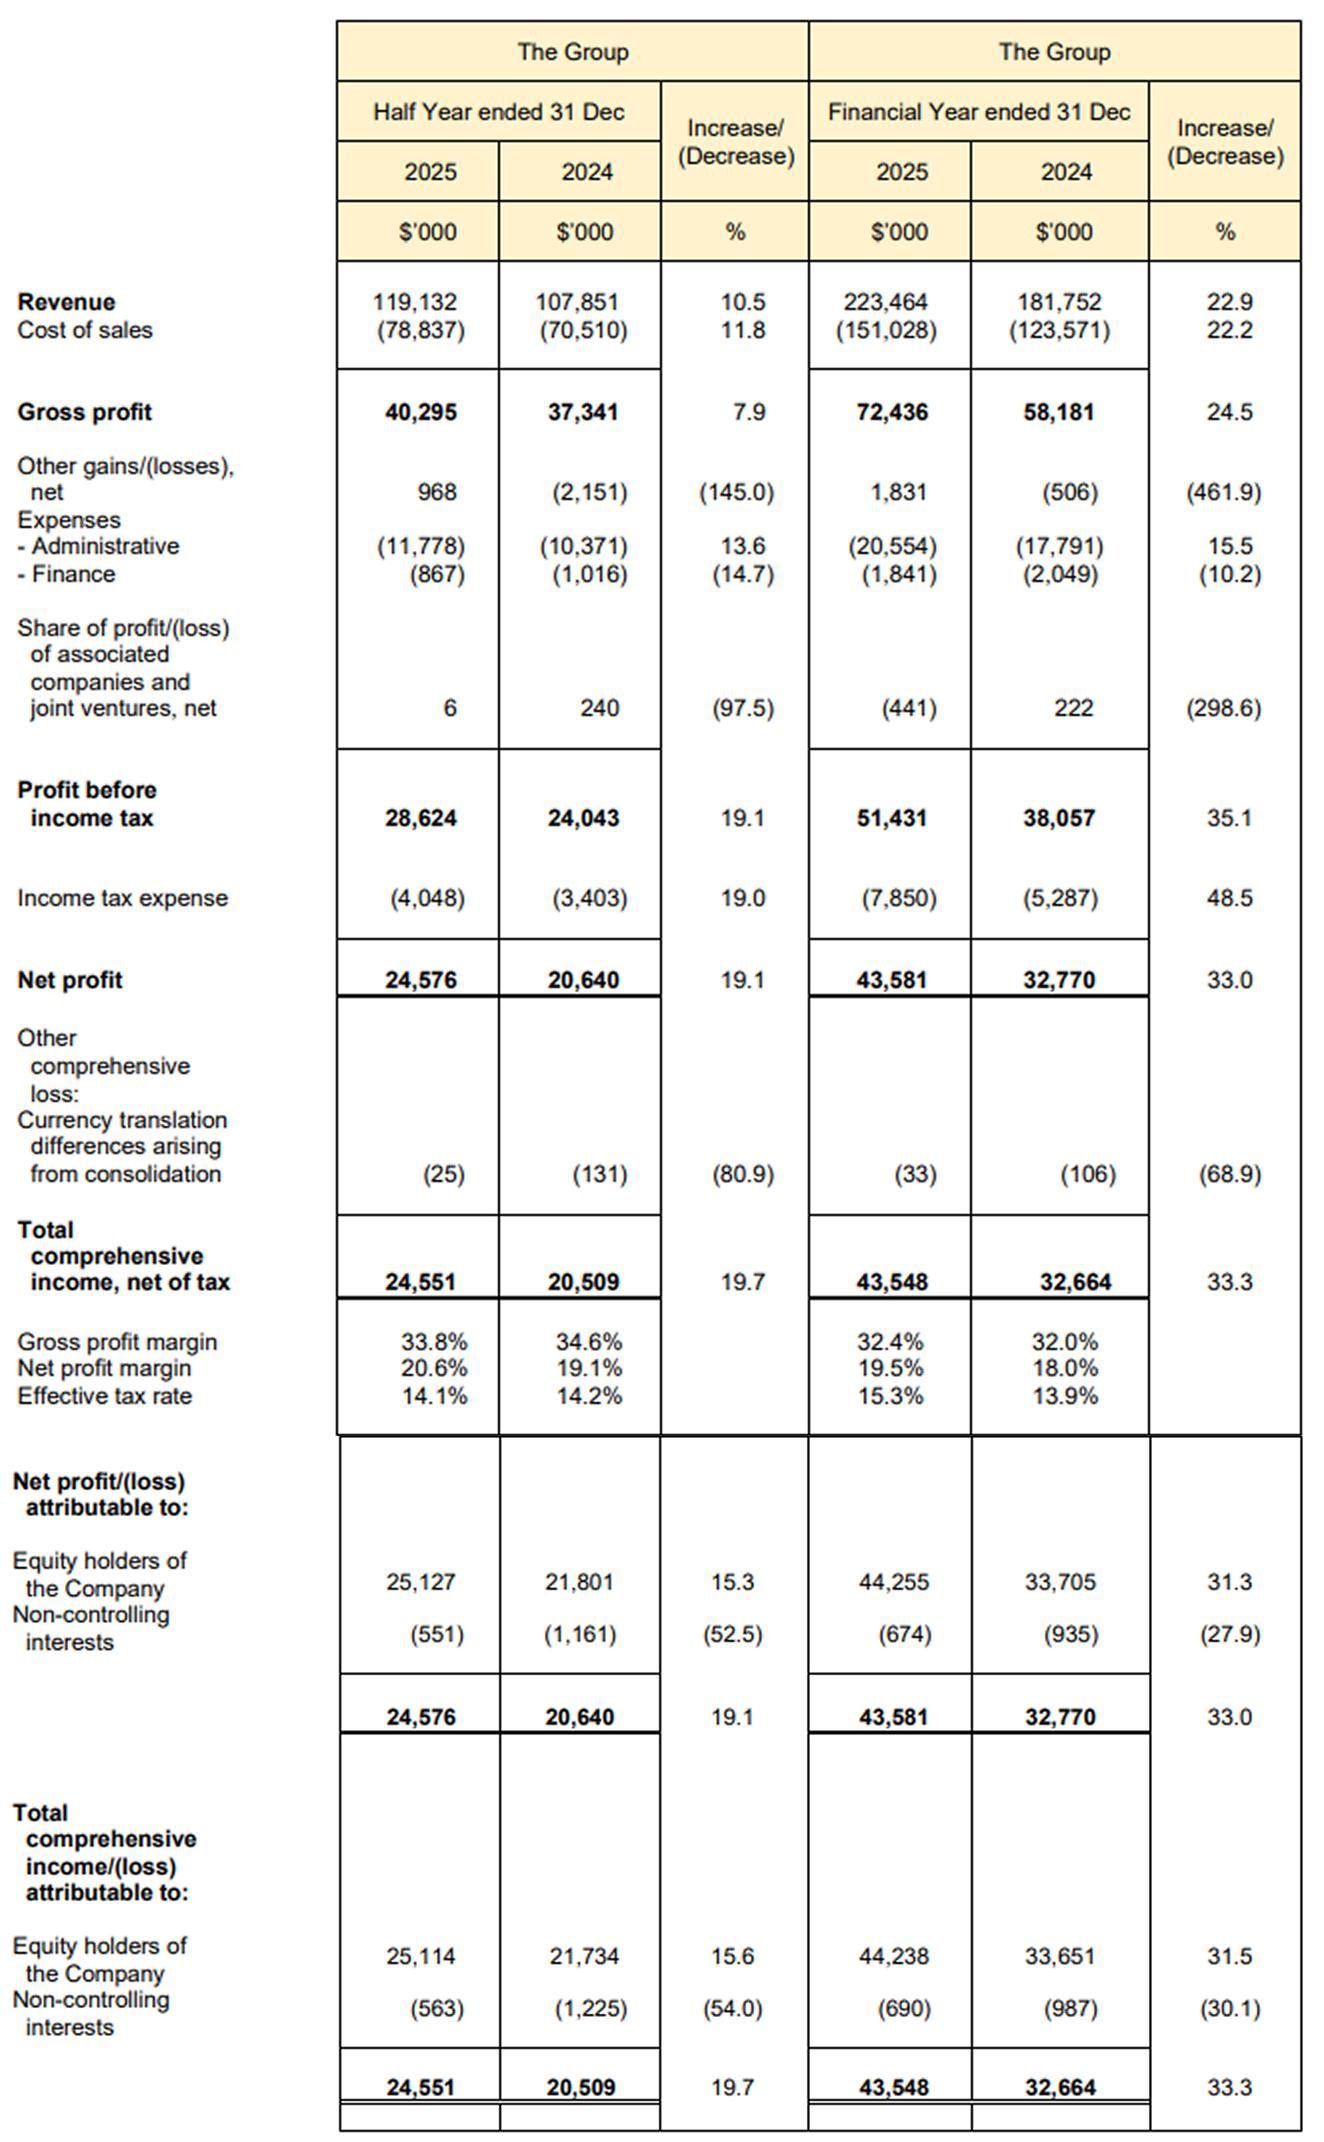
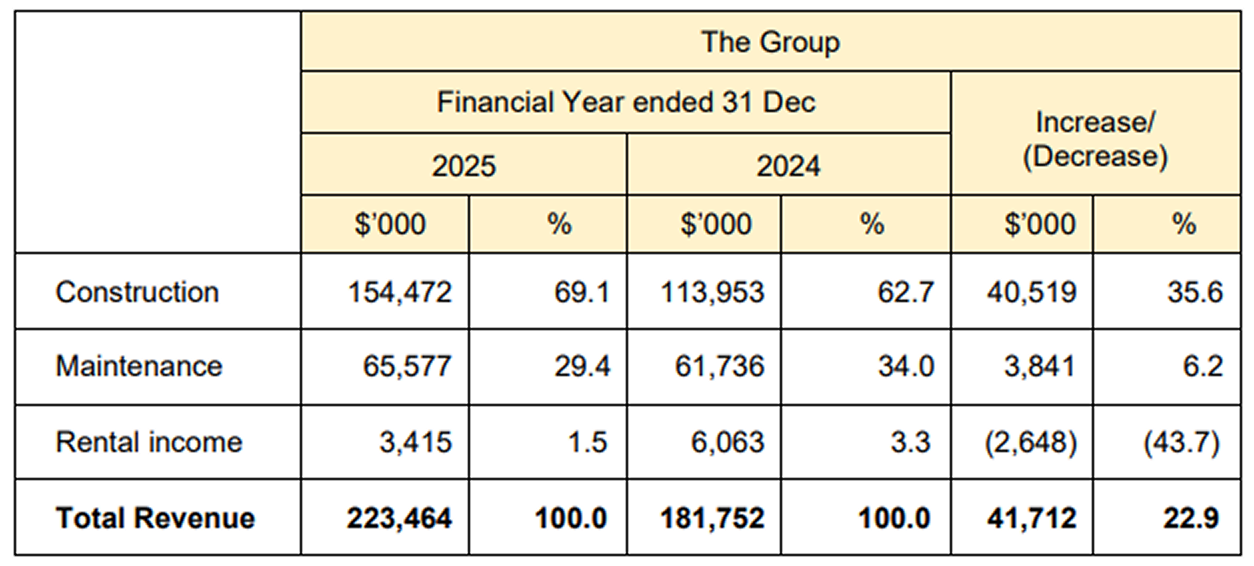
Our Group reported a 22.9% or $41.7 million increase in revenue to $223.5 million during the financial year ended 31 December 2025 ("FY2025"), compared to $181.8 million recorded in the preceding financial year ended 31 December 2024 ("FY2024"). The improvement was mainly due to the 35.6% increase in revenue from the construction segment to $154.5 million and a 6.2% increase in revenue from the maintenance segment to $65.6 million, partially offset by a 43.7% decrease in rental income.
Both the construction and maintenance segments exhibited positive revenue growth in FY2025 as compared to FY2024. The growth was primarily driven by a higher percentage of revenue recognised from various ongoing and newly awarded construction projects as they progressed to a more active phase in FY2025.
The decrease in rental income was mainly due to ongoing major renovations at the property located at 6-8 Bennett Street, East Perth, Western Australia and the transition period following tenant departures during the last financial year. These upgrades are expected to enhance the property's long-term value and future rental returns.
Both the construction and maintenance segments continue to be the major contributors to our Group's revenue. On a segmental basis, construction, maintenance and rental income contributed 69.1% (FY2024: 62.7%), 29.4% (FY2024: 34.0%) and 1.5% (FY2024: 3.3%) respectively to our Group's revenue for FY2025.
Cost of sales
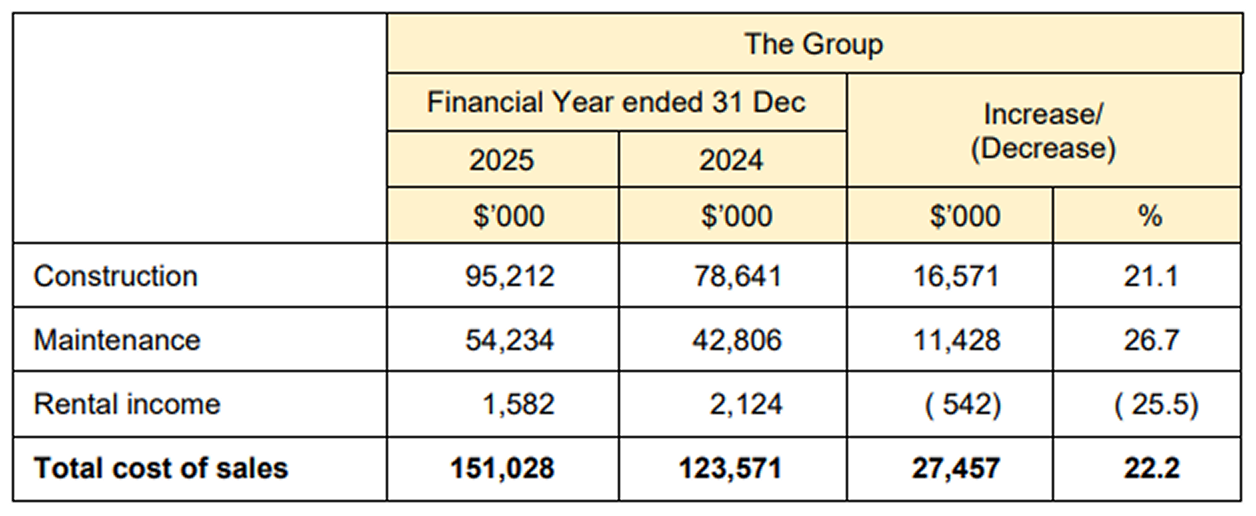
Our cost of sales increased by 22.2% or $27.4 million from $123.6 million for FY2024 to $151.0 million for FY2025. The increase in cost of sales, comprising sub-contracting costs, overheads and labour cost, was in line with the increase in business activities, during FY2025.
Gross profit and gross profit margin
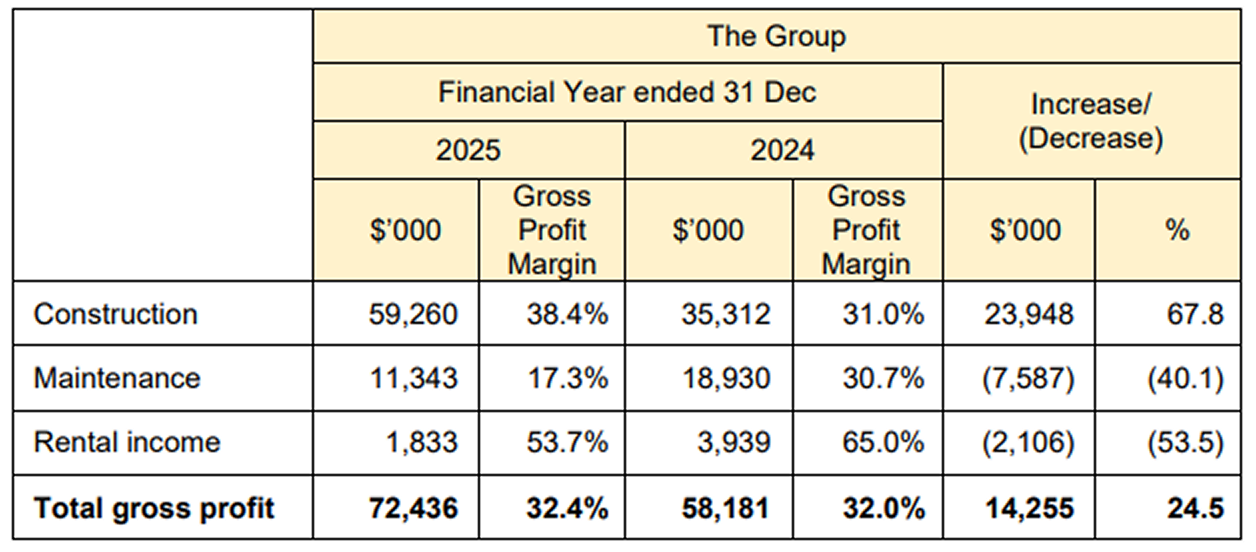
Our gross profit increased by 24.5%, an increase of $14.2 million increase from $58.2 million in FY2024 to $72.4 million in FY2025.
Construction segment exhibited a substantial increase of $23.9 million in gross profit, from $35.3 million in FY2024 to $59.2 million in FY2025. Meanwhile, maintenance segment recorded a decrease in gross profit contribution by $7.6 million, reducing from $18.9 million in FY2024 to $11.3 million in FY2025. Rental income segment also demonstrated a decrease in gross profit contribution by $2.1 million, reducing from $3.9 million in FY2024 to $1.8 million in FY2025.
The gross profit margin for the construction segment notably improved from 31.0% in FY2024 to 38.4% in FY2025. The improvement in the gross profit margin was largely attributable to the higher contributions from several projects which had commanded better gross profit margins during FY2025. In contrast, the decrease in the gross profit margin for maintenance segment from 30.7% in FY2024 to 17.3% in FY2025 was mainly due to projects progressing into more active phases, where a higher proportion of costs were incurred as compared to the initial stages.
Other gains/(losses), net
The Group recorded other gains of $1.8 million in FY2025 as compared to other losses of $0.5 million in FY2024. The improvement was mainly due to:
- a decrease in loss on foreign exchange of $1.2 million arising from the revaluation of
assets and liabilities denominated in Australian Dollars to Singapore Dollars;
- a decrease of $1.7 million in fair value loss on investment properties; and
- an increase of $0.6 million in government grants,
- a decrease in interest income by $0.5 million resulting from lower interest rate from
bank deposits;
- a decrease in dividend income by $0.5 million; and
- an increase in loss of disposal of right-of-use asset by $0.2 million,
Administrative expenses
Administrative expenses increased by $2.8 million or 15.5% from $17.8 million for FY2024 to $20.6 million for FY2025. The increase was largely due to:
- an increase of $2.3 million in directors' remuneration (including profit sharing accrued),
reflecting the higher profit generated by the Group; and
- an increase of $0.8 million in employee compensation due to salary adjustment and
higher provision for bonus,
- a decrease of $0.2 million in depreciation of property, plant and equipment; and
- a decrease of $0.1 million in medical expenses,
Finance expenses
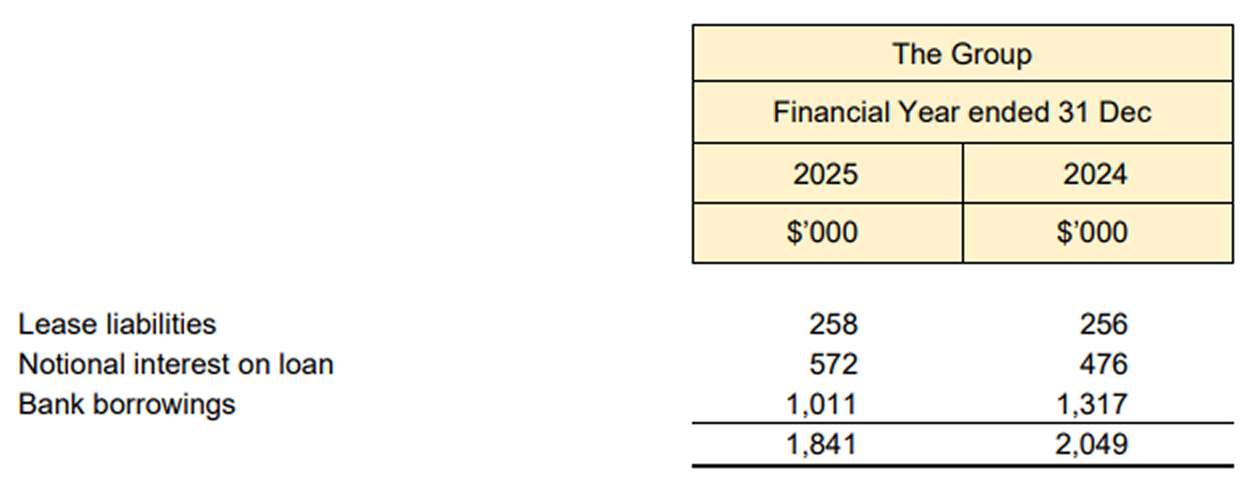
Finance expenses decreased by $0.2 million or 10.2%, from $2.0 million in FY2024 to $1.8 million in FY2025, mainly due to the decrease in borrowing costs arising from lower prevailing interest rates and no new major financing facilities obtained by the Group.
Share of results of associated companies and joint ventures
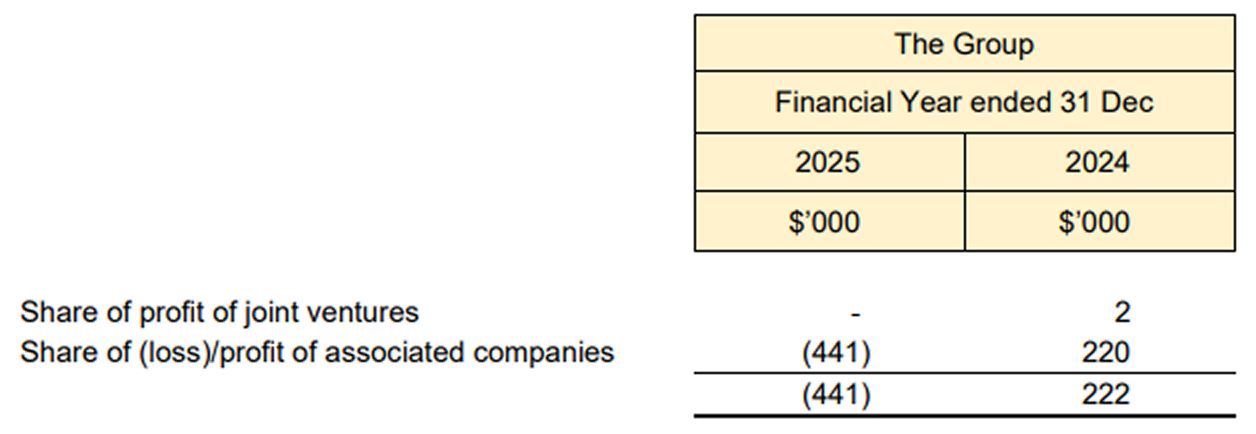
The share of profits of associated companies and joint ventures decreased by $0.6 million or 298.6% in FY2025. The decrease was mainly due to the Group's share of losses from its 22.5%-held associated company, Chong Kuo Development Pte Ltd.
Profit before income tax
Profit before income tax increased by $13.3 million or 35.1%, from $38.1 million for FY2024 to $51.4 million for FY2025. The increase was due mainly to (1) the increase in gross profit of $14.2 million, (2) the decrease in other losses of $2.3 million, and (3) the decrease in finance expenses of $0.2 million, which were partially offset by (4) the increase in administrative expenses of $2.8 million, and (5) the increase in share of losses of associated companies and joint ventures of $0.6 million, as explained above.
Income tax expense
Income tax expense increased by $2.5 million or 48.5% from $5.3 million in FY2024 to $7.8 million in FY2025, primarily driven by the Group's higher taxable profit, attributed to the operational profit derived from both ongoing and newly awarded projects.
The effective tax rates for FY2025 and FY2024 stood at 15.3% and 13.9%, respectively, which were lower than the statutory tax rate of 17%, due to the utilisation of tax credits.
Net loss attributable to non-controlling interests
Non-controlling interests of $0.7 million was due to the share of losses of our subsidiary corporation, Raffles Prestige Capital Pte Ltd, in FY2025.
Net profit
Overall, net profit increased by $10.8 million or 33.0%, from $32.8 million for FY2024 to $43.6 million for FY2025, following the increase in profit before income tax, which was partially offset by the increase in income tax expense, as explained above.
Our net profit margin increased from 18.0% for FY2024 to 19.5% for FY2025.
Review of income statements for the Half Year ended 31 December 2025
Revenue
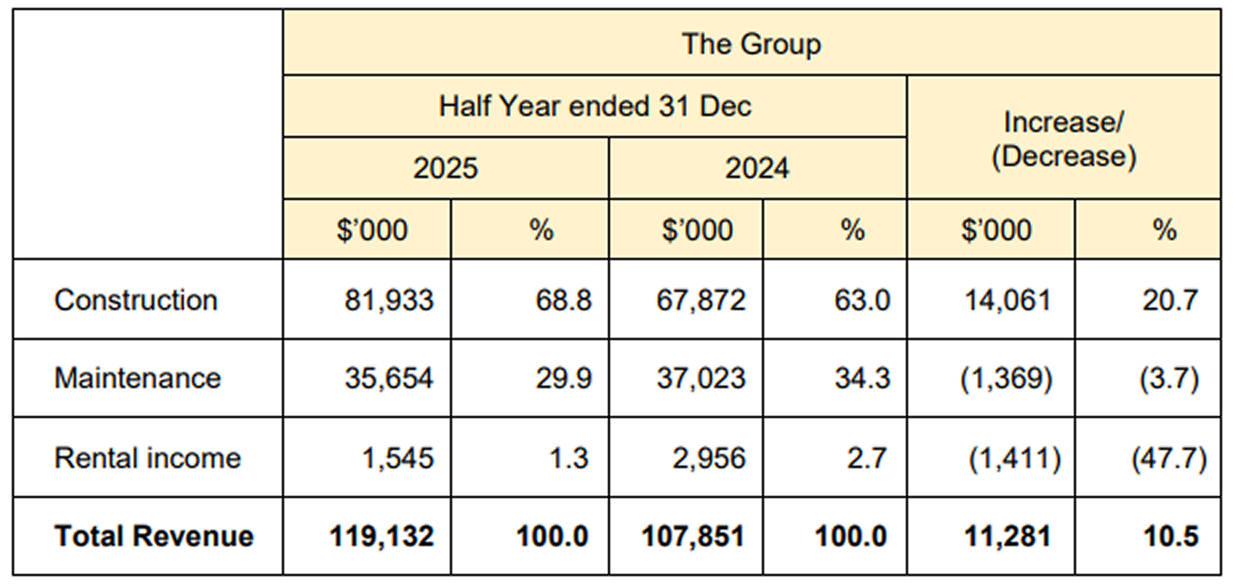
Our Group reported a 10.5% or $11.3 million increase in revenue to $119.1 million during the second half year ended 31 December 2025 ("2H2025") as compared to $107.8 million during the second half year ended 31 December 2024 ("2H2024"). The increase was due mainly to a 20.7% increase in revenue from the construction segment to $81.9 million, partially offset by a 3.7% decrease in revenue from the maintenance segment to $35.7 million and a 47.7% decrease in rental income.
The construction segment exhibited positive revenue growth in 2H2025 as compared to 2H2024. The growth was primarily driven by a higher percentage of revenue recognised from various ongoing and newly awarded construction projects as they progressed to a more active phase in 2H2025. The decrease in revenue from the maintenance segment in 2H2025 was due to completion of some maintenance projects in 2H2025.
The decrease in rental income was mainly due to ongoing major renovations at the property located at 6-8 Bennett Street, East Perth, Western Australia and the transition period following tenant departures during the last financial year. These upgrades are expected to enhance the property's long-term value and future rental returns.
The construction and maintenance segments remain the major revenue drivers for our Group. On a segmental basis, construction, maintenance and rental income accounted for 68.8% (2H2024: 63.0%), 29.9% (2H2024: 34.3%) and 1.3% (2H2024: 2.7%) respectively of our Group's revenue for 2H2025.
Cost of sales
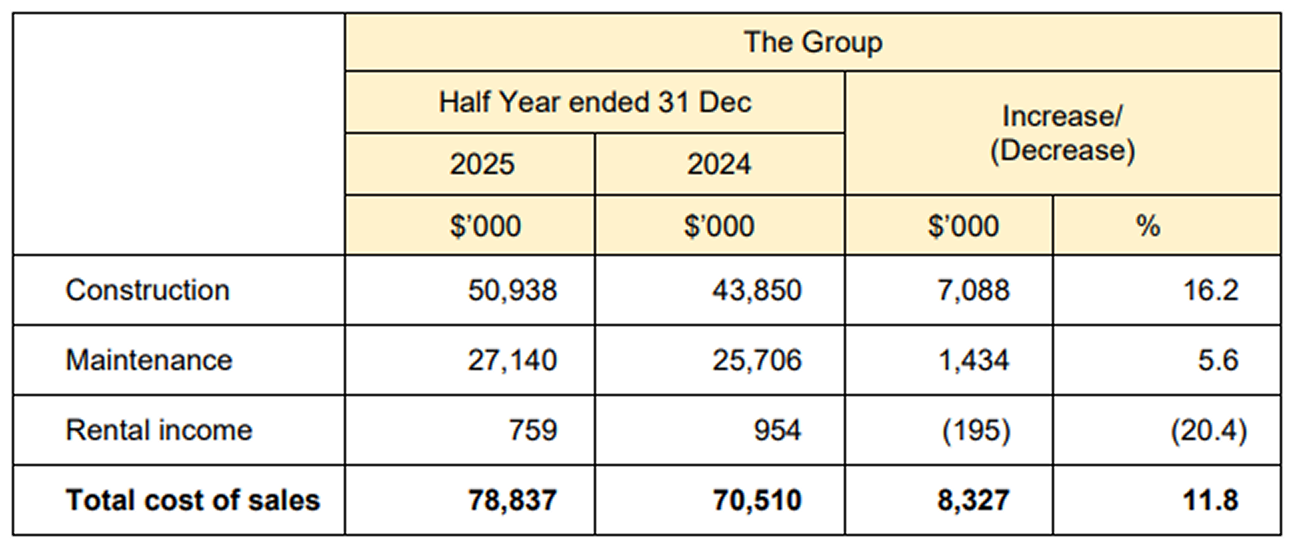
Our cost of sales increased by 11.8% or $8.3 million from $70.5 million for 2H2024 to $78.8 million for 2H2025. The increase in cost of sales, comprising sub-contracting costs, cost of construction materials, overheads and labour cost, was in line with the increase in business activities, during 2H2025.
Gross profit and gross profit margin
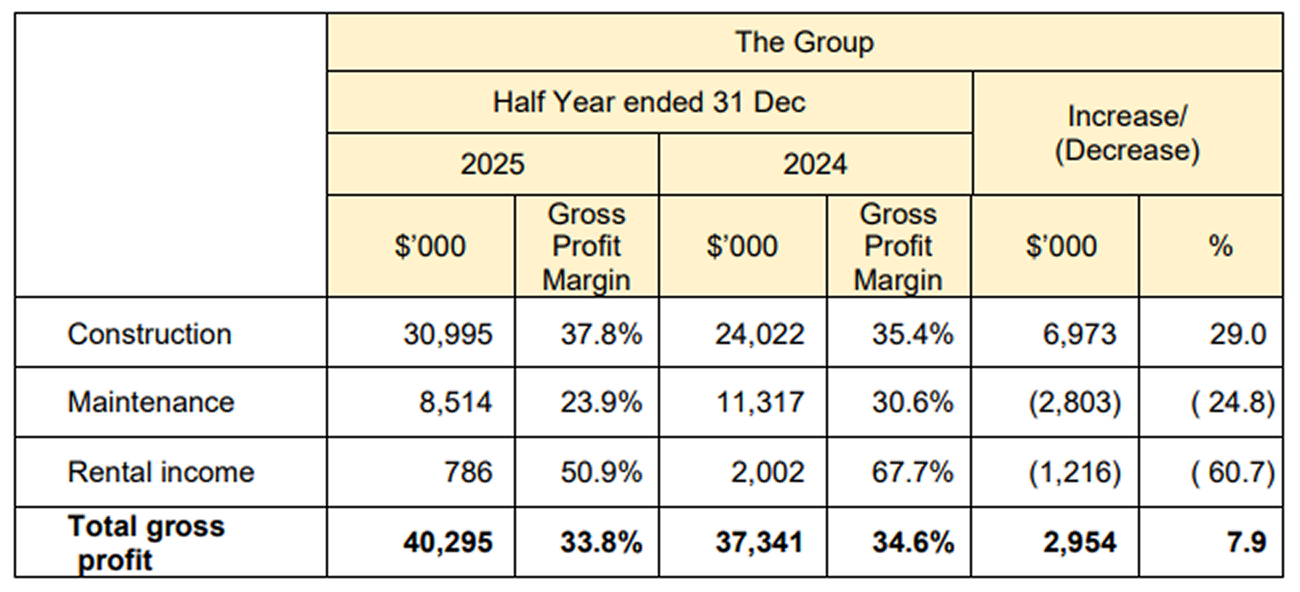
Overall, our gross profit for 2H2025 increased by 7.9% or $3.0 million from $37.3 million for 2H2024 to $40.3 million for 2H2025.
Construction segment exhibited a substantial increase of $7.0 million in gross profit, from $24.0 million in 2H2024 to $31.0 million in 2H2025. Meanwhile, maintenance segment recorded a decrease in gross profit contribution by $2.8 million, reducing from $11.3 million in 2H2024 to $8.5 million in 2H2025. Rental income segment also demonstrated a decrease in gross profit contribution by $1.2 million, reducing from $2.0 million in 2H2024 to $0.8 million in 2H2025.
For the construction segment, the gross profit margin increased from 35.4% in 2H2024 to 37.8% in 2H2025, largely attributable to the higher contributions from several projects which had commanded better gross profit margins during 2H2025. In contrast, the decrease in the gross profit margin for maintenance segment from 30.6% in 2H2024 to 23.9% in 2H2025 was mainly due to projects progressing to more active phases, where a higher proportion of costs were incurred as compared to the initial stages.
Other gains/(losses), net
The Group recorded other gains of $1.0 million in 2H2025 as compared to other losses of $2.1 million in 2H2024. The improvement was due mainly to:
- a decrease in loss on foreign exchange of $1.8 million arising from the revaluation of
assets and liabilities denominated in Australian Dollars to Singapore Dollars;
- a decrease of $1.7 million in fair value loss on investment properties; and
- an increase of $0.6 million in government grants,
- a decrease in interest income by $0.5 million resulting from lower interest rate from bank
deposits; and
- a decrease in dividend income by $0.5 million,
Administrative expenses
Administrative expenses increased by $1.4 million or 13.6% from $10.4 million in 2H2024 to $11.8 million in 2H2025. The increase was largely due to:
- an increase of $0.8 million in directors' remuneration (including profit sharing accrued),
reflecting the higher profit generated by the Group; and
- an increase of $0.6 million in employee compensation due to salary adjustment and
higher provision for bonus,
during 2H2025.
Finance expenses
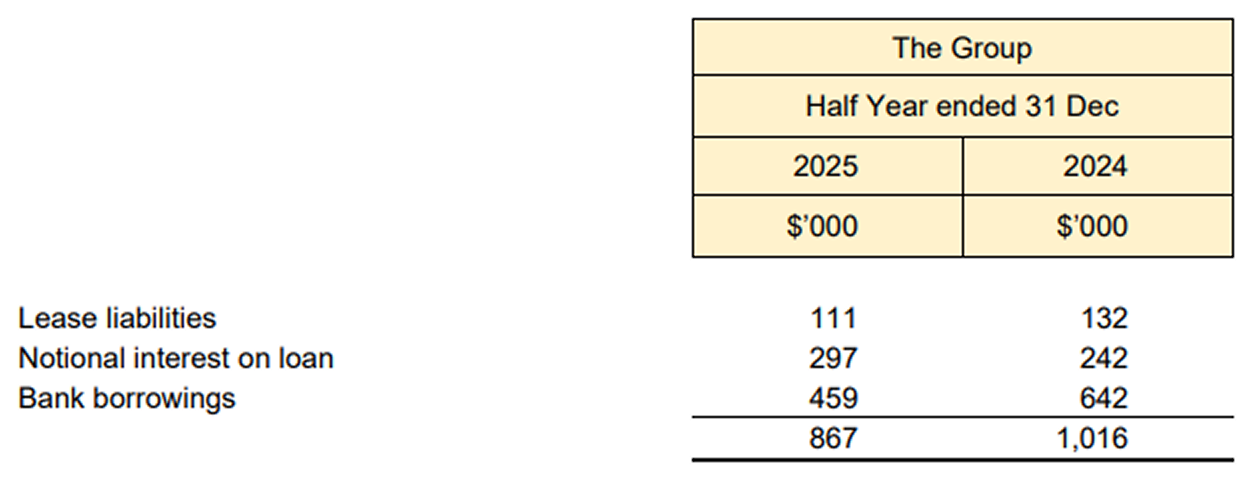
Finance expenses decreased by $0.1 million or 14.7%, from $1.0 million in 2H2024 to $0.9 million in 2H2025, mainly due to the decrease in borrowing costs arising from lower prevailing interest rates and no new major financing facilities obtained by the Group.
Share of results of associated companies and joint ventures
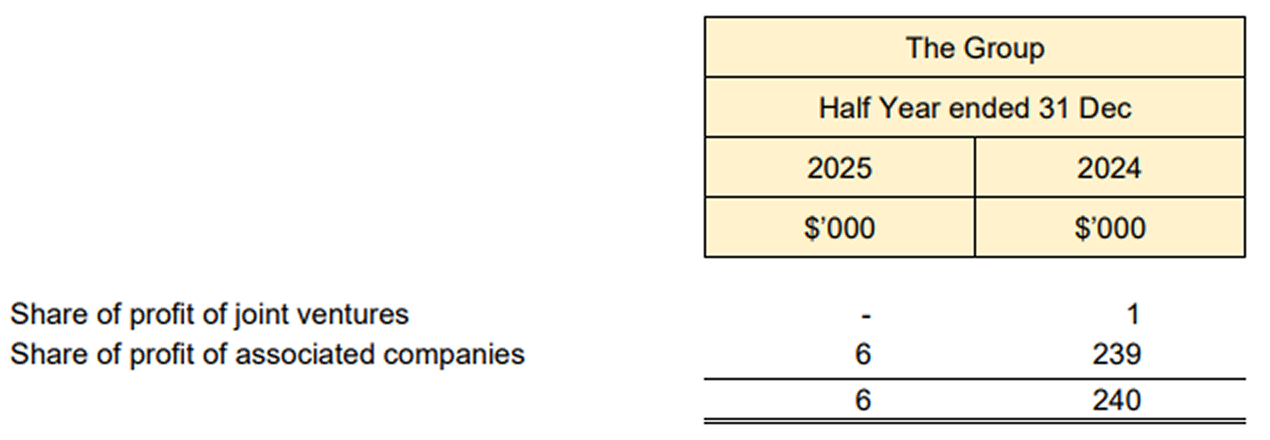
The share of results of associated companies and joint ventures decreased by $0.2 million or 97.5%. The decrease was attributable to the share of profits of the Group's 22.5%-held associated company, Chong Kuo Development Pte Ltd, during 2H2025.
Profit before income tax
Profit before income tax increased by $4.6 million or 19.1% from $24.0 million in 2H2024 to $28.6 million in 2H2025. The increase was due mainly to (1) the increase in gross profit of $3.0 million, (2) the decrease in other losses of $3.1 million, and (3) the decrease in finance expenses of $0.1 million, which were partially offset by (4) the increase in administrative expenses of $1.4 million, and (5) the decrease in share of results of associated companies and joint ventures of $0.2 million, as explained above.
Income tax expense
Income tax expense was mainly in relation to the operating profits registered by the profitable entities within the Group. The increase of income tax expense by $0.6 million or 19.0% from $3.4 million in 2H2024 to $4.0 million in 2H2025, was primarily driven by the Group's higher taxable profit, attributed to the operational profit derived from both ongoing and newly awarded projects.
The effective tax rates for 2H2025 and 2H2024 stood at 14.1% and 14.2%, respectively, which were lower than the statutory tax rate of 17%, due to the utilisation of tax credits.
Net loss attributable to non-controlling interests
Non-controlling interests of $0.6 million was due to the share of losses of our subsidiary corporation, Raffles Prestige Capital Pte Ltd, in 2H2025.
Net profit
Overall, net profit increased by $4.0 million or 19.1%, from $20.6 million in 2H2024 to $24.6 million in 2H2025, following the increase in profit before income tax of $4.6 million, partially offset by the increase in income tax expense of $0.6 million, as explained above.
Our net profit margin improved from 19.1% in 2H2024 to 20.6% in 2H2025.
Review of the financial position for the Financial Year ended 31 December 2025
Current assets
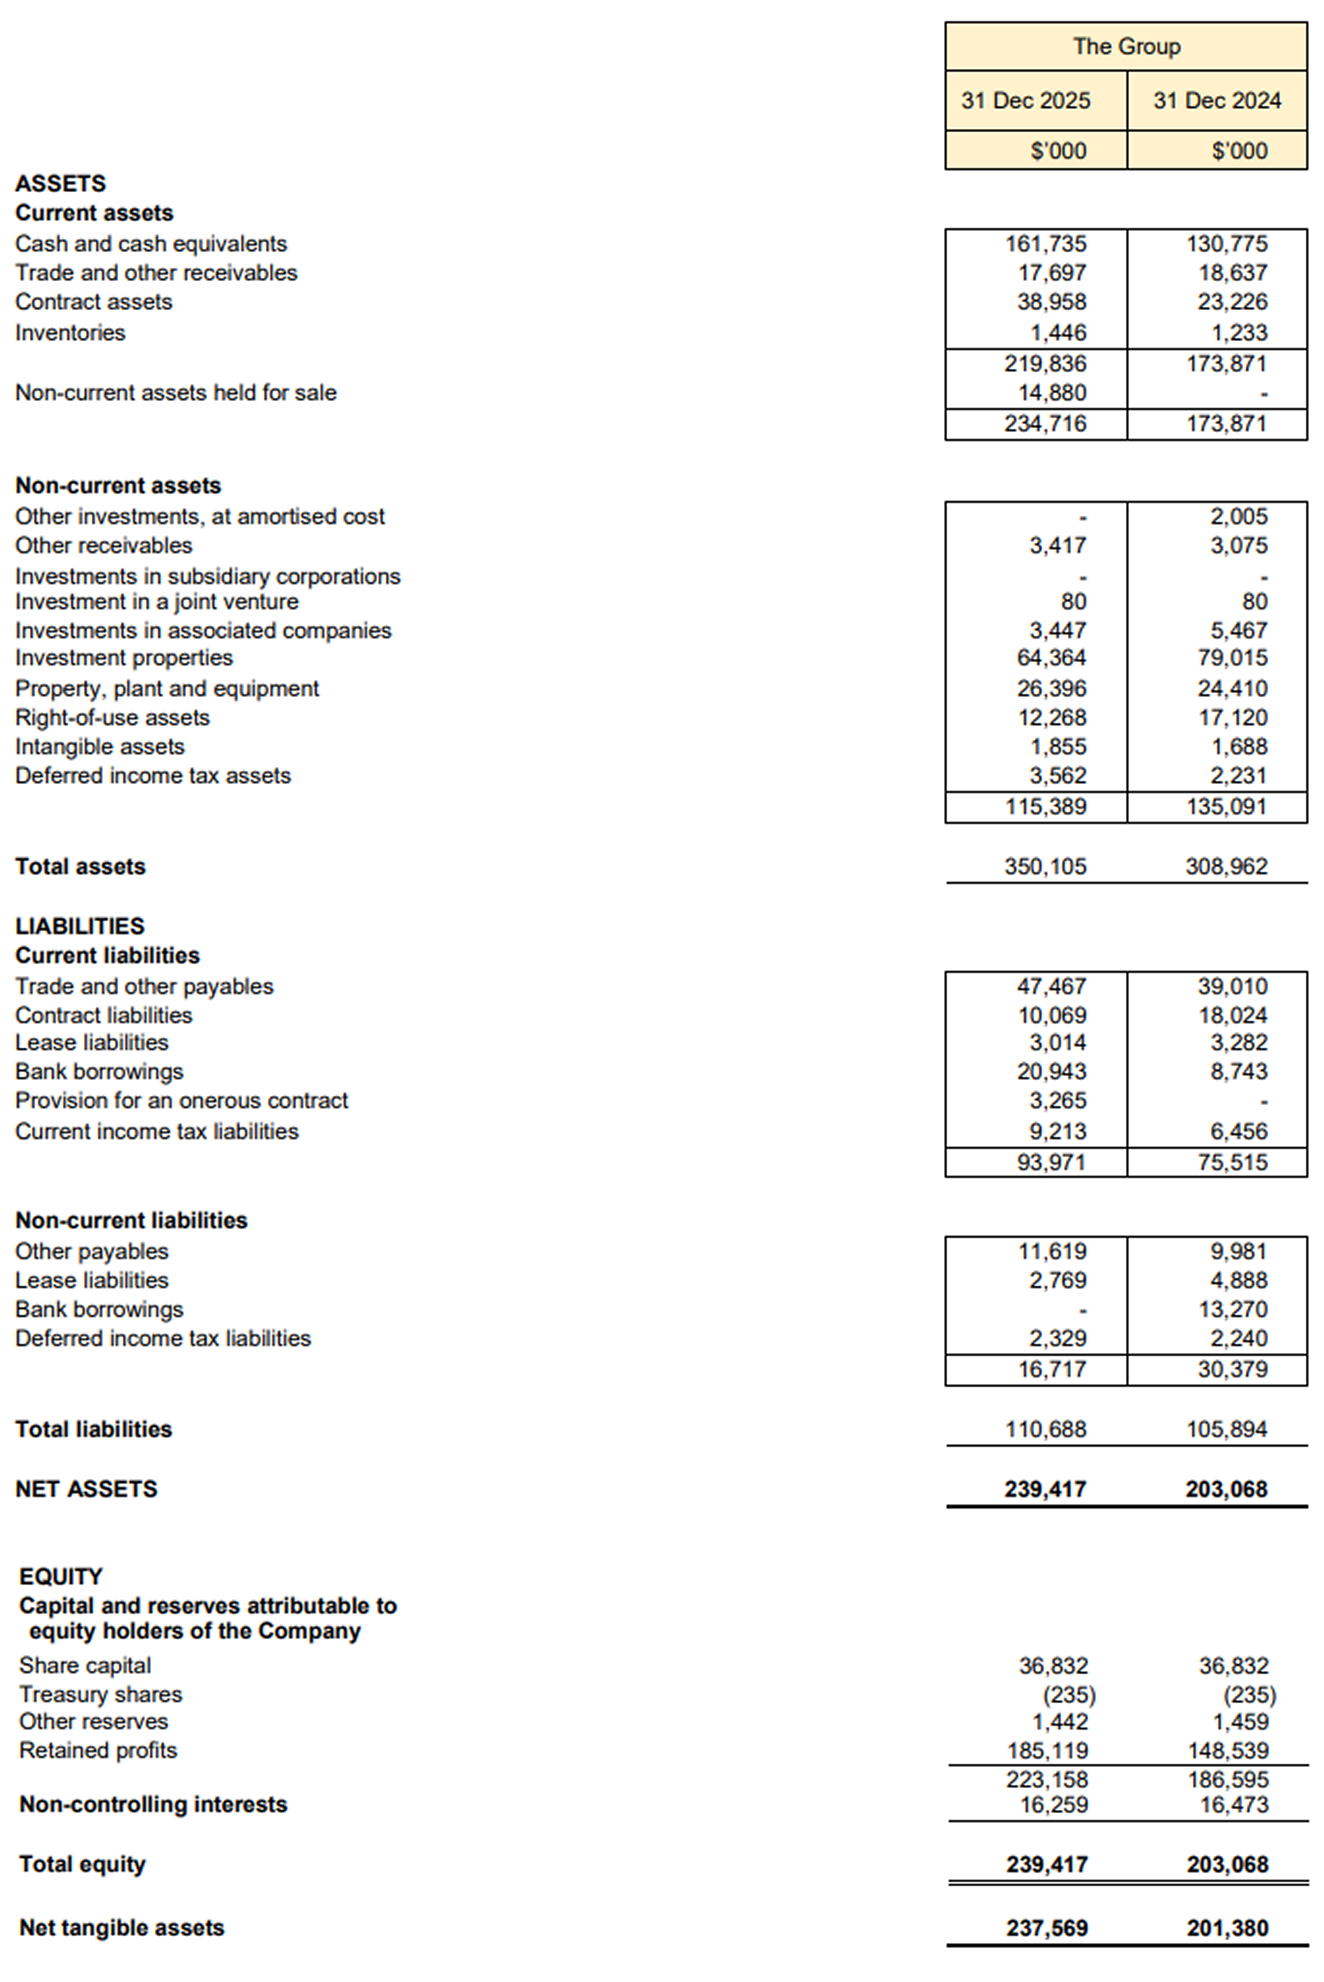
Current assets increased by $60.8 million, from $173.9 million as at 31 December 2024 to $234.7 million as at 31 December 2025. The increase was primarily driven by:
- a $30.9 million boost in cash and cash equivalents, mainly due to $43.3 million
generated from operating activities and $0.1 million in cash generated from investing
activities, alongside $11.8 million in cash used in financing activities, and a decrease
of $0.7 million in pledged deposits;
- an increase in contract assets of $15.7 million due to the timing difference between
revenue recognised and billings for the on-going projects;
- an increase of $0.2 million in inventories, attributed to the utilisation of materials for
ongoing construction and maintenance projects; and
- an increase in non-current assets held for sale of $14.9 million, following the
proposed sale of the investment properties located at 69 & 71 Kampong Bahru Road,
- a decrease of $0.9 million in trade and other receivables, as a result of prompt
payments received from on-going construction and maintenance projects,
Non-current assets
Non-current assets decreased by $19.7 million, from $135.1 million as at 31 December 2024 to $115.4 million as at 31 December 2025. The decrease was due mainly to:
- a decrease of $2.0 million in other investments, at amortised cost due to early
termination;
- a decrease of $2.0 million in investments in associated companies, driven by a
return of capital following a bonus issue, after adjusting for the share of losses in
Chong Kuo Development Pte Ltd;
- decrease in right-of-use assets by $4.8 million resulting from depreciation and the
reclassification of right-of-use assets to property, plant and equipment upon full
repayment of lease liabilities; and
- a decrease in investment properties by $14.6 million due to reclassification of $14.9
million to non-current assets held for sale following the proposed sale of the
investment properties, and an increase of $1.0 million from structural improvements
and a foreign exchange realignment of $0.4 million relating to the property at 6-8
Bennett Street, net of a fair value loss of $1.2 million,
- an increase in other receivables by $0.3 million due to amortisation of notional fair
value from the loan extended to USB Holdings Pte Ltd;
- an increase in property, plant and equipment of $2.0 million, attributable to the
additions and reclassification from right-of-use assets upon full repayment of lease
liabilities;
- an increase in intangible assets of $0.2 million; and
- an increase in deferred income tax assets of $1.3 million arising from the
recognition of deferred income tax assets in one of the subsidiary corporations,
Current liabilities
Current liabilities increased by $18.5 million, from $75.5 million as at 31 December 2024 to $94.0 million as at 31 December 2025. The increase was due mainly to:
- an increase of $8.4 million in trade and other payables, attributable to the increase
of $4.2 million in trade payables, an increase of $4.0 million in accruals, and
increase of $0.2 million in deposits received;
- an increase in bank borrowings of $12.1 million, arising from the reclassification
of term loans taken by a subsidiary corporation, Raffles Prestige Capital Pte Ltd,
from non-current to current, arising from (1) the proposed sale of the investment
properties resulting in a related loan being repaid upon the completion of the sale,
and the intended early settlement of another loan using the net proceeds of the
proposed sale, and (2) the debt service coverage ratio of the latter loan falling
below the required level, although such requirement has since been waived by
the lender for FY2025, subject to certain conditions which will be fulfilled;
- an increase of $3.3 million in provision for an onerous contract; and
- an increase of $2.7 million in current income tax liabilities due to higher tax
provision allocated for profitable entities within the Group,
- a decrease of $8.0 million in contract liabilities, reflecting revenue recognised as
performance obligations were fulfilled on three public sector construction contracts,
Non-current liabilities
Non-current liabilities decreased by $13.7 million, from $30.4 million as at 31 December 2024 to $16.7 million as at 31 December 2025. The decrease was due mainly to:
- a decrease in bank borrowings of $13.3 million, arising from the reclassification of
term loans from non-current to current; and
- a decrease in lease liabilities of $2.1 million arising from the repayment of bank
facilities,
- an increase in non-trade payables of $1.6 million, arising from advances of $1.5
million extended by a non-controlling interest and a foreign exchange impact of
$0.1 million; and
- an increase of $0.1 million in deferred income tax liabilities,
Shareholders' equity
Shareholders' equity increased by $36.3 million, from $203.1 million as at 31 December 2024 to $239.4 million as at 31 December 2025. The increase was primarily driven by:
- profits generated from operations amounting to $44.2 million attributable to equity
holders of the Company,
- dividend payment to shareholders of $7.7 million; and
- a decrease of $0.2 million in non-controlling interests as a result of fair value
adjustment on interest-free loans,
Review of cash flows for the Financial Year ended 31 December 2025
Net cash provided by operating activities
Our Group reported net cash generation of $43.4 million from operating activities in FY2025, marking a decrease of $14.9 million, compared to $58.3 million in FY2024. The decrease was largely attributable to:
- a decrease in net working capital inflow of $25.8 million;
- a decrease in interest received totalling $0.5 million; and
- an increase in income tax payments of $3.6 million,
- an increase in cash generated from operating activities before working capital
changes, amounting to $15 million,
Net cash used in investing activities
Net cash used in investing activities decreased by $4.5 million from $4.4 million in FY2024 to net cash provided by investing activities of $0.1 million in FY2025. The decrease was due mainly to:
- a decrease of $1.6 million in cash used for the purchase of property, plant and
equipment;
- a decrease of $0.8 million in advances extended to an associated company;
- an increase of $2.4 million in proceeds received from disposal of other investments at
amortised cost, property, plant and equipment and right-of-use assets; and
- total proceeds of $1.2 million received from an associated company relating to capital
reduction and dividend income,
- an increase of $0.1 million in cash used for the purchase of right-of-use assets;
- an increase of $0.2 million in cash used for the purchase of intangible assets;
- an increase of $0.2 million in structural improvements that were capitalised to
investment properties; and
- a decrease of $1.0 million in repayment of loan from associated company,
Net cash used in financing activities
Net cash used in financing activities increased by $0.5 million, from $11.3 million in FY2024 to $11.8 million in FY2025. The increase was due mainly to:
- an increase of $3.1 million in dividend disbursements,
- a decrease of $0.1 million in repayment of lease liabilities;
- a decrease of $0.1 million in principal repayment of borrowing;
- a decrease of $0.3 million in interest paid;
- an increase of $0.9 million in advance from a non-controlling shareholder; and
- an increase of $1.2 million in pledged bank deposits,
Overall, free cash and cash equivalents stood at $155.9 million as at 31 December 2025, marking a notable increase of $31.6 million from $124.3 million as at 31 December 2024. This represents cash reserves of 50.8 cents per share as at 31 December 2025, a marked increase from the 40.5 cents per share recorded as at 31 December 2024 (based on 306,961,494 issued shares).
Commentary
Economic Outlook
Based on figures released by the Ministry of Trade and Industry ("MTI") on 10 February 2026, Singapore's economy expanded by 5.0% in 2025, easing from the 5.3% growth in 2024. In the fourth quarter of 2025, Singapore's economy expanded by 6.9% year-on-year, faster than the 4.6% growth in the previous quarter. On a quarter-on-quarter seasonally-adjusted basis, the economy grew by 2.1%, moderating from the 2.6% expansion in the third quarter. MTI has upgraded Singapore's GDP growth forecast from 1.0 to 3.0 per cent to 2.0 to 4.0 per cent for 2026.
On 29 January 2026, the Monetary Authority of Singapore ("MAS") announced that it will maintain the Singapore dollar nominal effective exchange rate ("S$NEER") policy band, with no change to the width of the band or the level at which it was centred. For the full year, MAS noted that Singapore's GDP growth is expected to remain resilient but ease relative to the stronger performance in 2025, with the positive output gap projected to narrow over the course of the year. Core inflation is also expected to increase modestly in the near term.
Industry Outlook
According to MTI, growth in Singapore's construction sector came in at 4.6% year-on-year in the fourth quarter, moderating from the 5.6% growth in the third quarter. Growth during the quarter was supported by expansions in both public and private sector construction output. On a quarter-on-quarter seasonally adjusted basis, the sector eased to 0.2%, from 0.6% in the previous quarter. For the whole of 2025, the sector expanded by 5.2%, after growing by 5.4% in 2024.
For 2026, the Building and Construction Authority ("BCA") projects the total value of construction demand to remain steady at between S$47 billion and S$53 billion, similar to 2025. The sustained construction demand is supported by the expected award of additional construction packages for Changi Terminal 5 ("T5") Development, Marina Bay Sands Integrated Resort expansion, New Tengah General & Community Hospital, Downtown Line 2 Extension and Thomson-East Coast Line Extension.
Over the medium term, BCA expects construction demand to average between S$39 billion and S$46 billion per year from 2027 to 2030. While the medium-term outlook appears positive, supported by a strong pipeline of large developments, project schedules may still change due to unforeseen global economic risks. As the Changi T5 development is a one-off project, industry demand could moderate following its completion, potentially reverting to preCOVID levels. To drive industry transformation and enhance productivity, the government will be focusing on initiatives that help companies build more advanced capabilities in digital solutions, robotics and automation.
The Group continues to be sustained by a strong pipeline of projects and will continue to focus on projects that align with our core competencies in transport infrastructure and civil engineering, while exploring other opportunities to diversify into property development and other investments in Singapore and overseas. In line with our long-term vision, OKP is also investing in and adopting technologies to enhance productivity, improve operational efficiency and drive innovation.
Company Outlook and Order Book Update
Against this backdrop, the Group remains cognisant of ongoing macroeconomic uncertainties, including geopolitical tensions and supply chain challenges, that continue to exert cost pressures across the construction sector. Notwithstanding these challenges, the Group will continue to focus on building a sustainable and resilient business anchored on disciplined execution, prudent financial management and strong project delivery capabilities.
The Group continues to be supported by a pipeline of construction projects, underpinned by its established track record and extensive experience in civil engineering and infrastructure works, particularly for the public sector.
During the year, the Group secured several contract awards. In November 2025, the Group's wholly-owned subsidiary, Eng Lam Contractors Co (Pte) Ltd, secured a $22.6 million contract from JTC Corporation for infrastructure works at CleanTech Loop (Phase 2A) within the Jurong Innovation District. In May 2025, the Group was awarded a $258.3 million contract from the Land Transport Authority for the construction of new cycling paths for East Region in Singapore across 11 towns. As at 31 December 2025, the Group's order book stood at $588.0 million, with projects extending till 2031.
The Group remains selective in its tendering activities, focusing on projects that align with its technical expertise and risk profile, while maintaining a strong emphasis on cost controls, timely delivery and disciplined cashflow management.
On the property front, the Group continues to adopt a measured and opportunistic approach, aligned with its long-term strategy and risk profile. The Group's residential project in Bukit Panjang, Phoenix Residences, comprising 74 units, has attained its Temporary Occupation Permit ("TOP") in January 2025 and received its Certificate of Statutory Completion ("CSC") from the Building and Construction Authority on 6 August 2025.
For its property investment business, the Group's investment property at 6-8 Bennet Street in Perth, Australia, continues to generate a positive stream of recurring rental income. The Group continues to manage the asset with a focus on value preservation and income stability. The on-going improvements are anticipated to enhance the property's long-term value while also increasing its potential for higher rental income and attracting new tenants. The Group also holds a freehold, three-story shophouse at 35 Kreta Ayer Road in Singapore, held through the Group's 51%-owned subsidiary, Raffles Prestige Capital Pte. Ltd. The above assets form part of the Group's recurring income strategy and contribute positively to overall performance.
Supported by its strong track record and industry expertise, the Group remains focused on its core construction business while strengthening earnings resilience through disciplined execution and recurring income streams. By maintaining financial prudence and operational focus, the Group is well-positioned to navigate prevailing market conditions and deliver sustained value to its stakeholders.
![]()
![]()
![]()
![]()
Copyright © 2026. ListedCompany.com. All Rights Reserved.