
Operations Review
BUSINESS REVIEW
(i) Construction
Completed Construction Projects
No construction projects have been completed during the year under review.
Ongoing Construction Projects
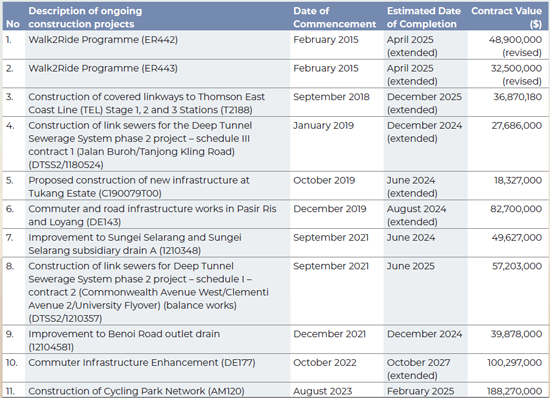
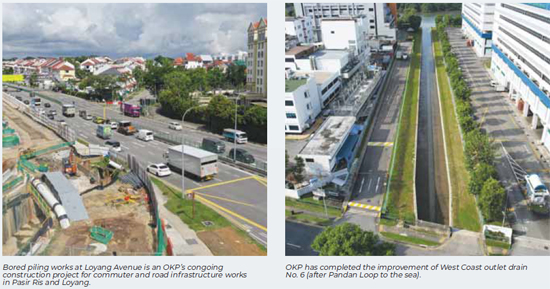
In 2023, we diligently progressed with the execution of 11 active construction projects, which had been secured since February 2015. Among these projects was a new contract awarded by the Land Transport Authority (LTA) in August 2023 for the construction of the Cycling Park Network.
The construction segment remained the primary revenue driver for OKP, accounting for 63.8 per cent or $102.4 million of the total revenue in FY2023.
List of Ongoing Construction Projects
(ii) Maintenance
Completed Maintenance Projects
During the year under review, one maintenance project, which was secured since 2021, was completed.
List of Completed Maintenance Projects

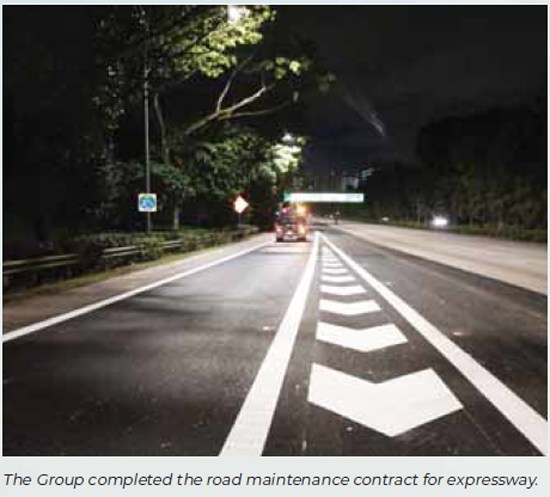
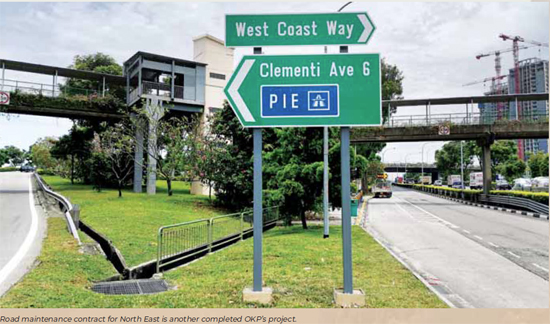
In addition, two road maintenance contracts executed by a joint venture partnership, Eng Lam – United E&P JV, comprising one for Expressway (TR310A) and another for North East Sector (TR310B), were completed during the year under review.

In addition to providing a stable and recurring income stream for the Group, our maintenance segment remains a cornerstone of the services provided to our clients. This segment contributed $51.6 million, which constituted 32.2 per cent of OKP's total revenue, in FY2023.
Ongoing Maintenance Projects
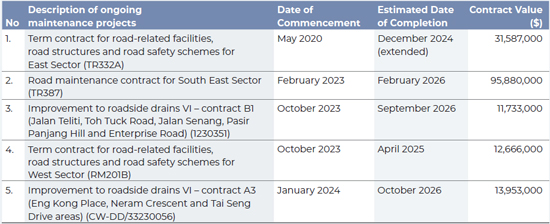
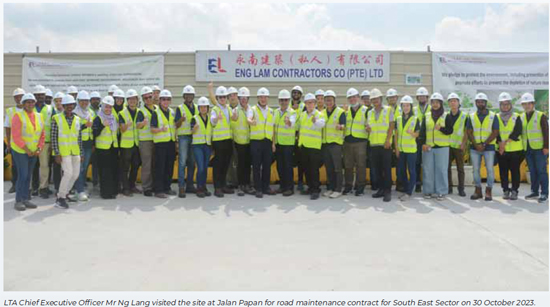
In 2023, we secured four projects. Two projects were awarded by the Public Utilities Board while two projects were awarded by the LTA. These four new contracts awarded during the year are – the road maintenance contracts for South East Sector; improvement to roadside drains VI covering Jalan Teliti, Toh Tuck Road, Jalan Senang, Pasir Panjang Hill and Enterprise Road; term contract for road-related facilities, road structures and road safety schemes for West Sector; as well as improvement to roadside drains VI covering Eng Kong Place, Neram Crescent and Tai Seng Drive areas.
We continued to execute five ongoing maintenance projects, including the four newly secured contracts.
List of Ongoing Maintenance Projects
(iii) Rental Income
Rental income contributed $6.4 million or 4.0 per cent of our Group's total revenue for FY2023, up from $6.3 million in the previous year.
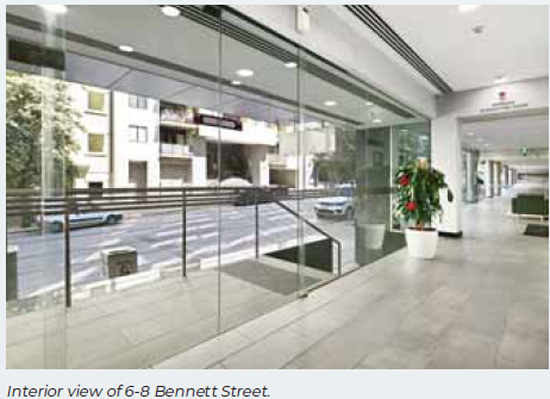
The marginal increase in rental income was mainly from the rental income generated by the property located at 6-8 Bennett Street, East Perth, Western Australia.

Financial Review
Income Statement
Balance Sheet

Income Statement
Revenue
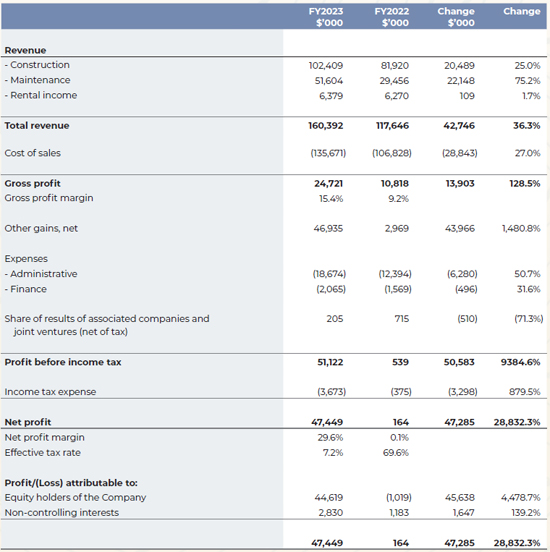
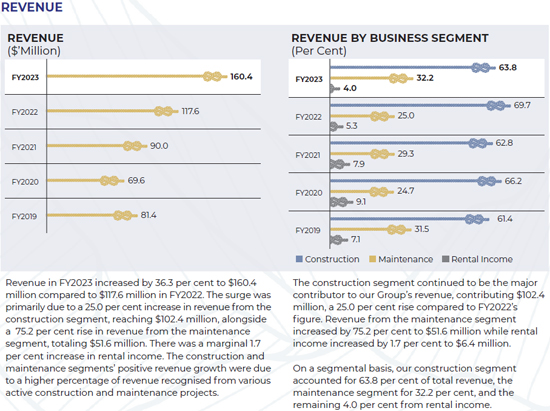
Our Group reported a substantial 36.3% or $42.7 million increase in revenue to $160.4 million during the financial year ended 31 December 2023 (FY2023), compared to $117.6 million recorded in the preceding financial year ended 31 December 2022 (FY2022). The surge was primarily due to a 25.0% increase in revenue from the construction segment, reaching $102.4 million, alongside a remarkable 75.2% rise in revenue from the maintenance segment, totalling $51.6 million. Additionally, there was a marginal 1.7% increase in rental income.
Both the construction and maintenance segments exhibited positive revenue growth in FY2023 as compared to FY2022. It was mainly attributable to a higher percentage of revenue recognised from various ongoing and newly awarded construction and maintenance projects as they progressed to a more active phase in FY2023.
The slight increase in rental income was mainly from the rental income generated by the property located at 6-8 Bennett Street, East Perth, Western Australia.
The construction and maintenance segments remain the major revenue drivers for our Group. On a segmental basis, construction, maintenance and rental income contributed 63.8% (FY2022: 69.7%), 32.2% (FY2022: 25.0%) and 4.0% (FY2022: 5.3%) respectively to our Group's revenue for FY2023.
Revenue

Cost of Sales
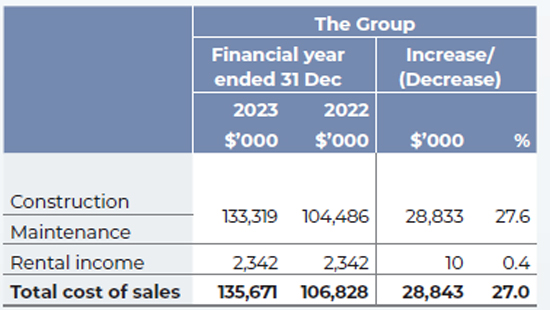
Our cost of sales saw a significant increase of 27.0%, translating to a $28.9 million increase from $106.8 million in FY2022 to $135.7 million in FY2023. The increase in cost of sales was attributed mainly to:
- an increase in sub-contracting costs, predominantly
comprising costs related to premix works, signages,
asphalt works, mechanical and electrical works,
soil testing, landscaping and metalworks, typically
outsourced to external parties;
- an increase in labour cost due to increased headcount
and a higher provision for bonus;
- an increase in the cost of construction materials,
driven by higher utilisation of materials and price
hikes in construction materials; and
- an increase in overheads, particularly hiring costs
associated with the rental of additional heavy
equipment and machineries to support ongoing and
newly awarded projects,
during FY2023.
Gross Profit And Gross Profit Margin

Our gross profit increased by 128.5%, amounting to a $13.9 million increase from $10.8 million in FY2022 to $24.7 million in FY2023.
While the rental income segment demonstrated a marginal increase in gross profit contribution by $0.1 million, rising from $3.9 million in FY2022 to $4.0 million in FY2023, the construction and maintenance segments exhibited a substantial $13.8 million increase, soaring from $6.9 million in FY2022 to $20.7 million in FY2023.
The gross profit margin for the construction and maintenance segments notably improved from 6.2% in FY2022 to 13.4% in FY2023 The improvement in the gross profit margin was mainly attributed to the Group's ongoing initiatives to enhance cost management, notwithstanding the challenges posed by higher material costs and rising manpower costs.
Other Gain, Net
Other gains demonstrated a notable increase of $43.9 million or 1,480.8%, rising from $3.0 million in FY2022 to $46.9 million in FY2023. The substantial increase was mainly due to:
- an increase in interest income by $1.2 million resulting
from higher fixed deposit placement and higher
interest rate from bank deposits;
- the receipt of an arbitral award of $43.8 million in
relation to the Contract 449A worksite incident;
- an increase of $2.7 million in fair value gain on
investment properties; and
- a decrease of $0.8 million in the loss on foreign
exchange arising from the revaluation of assets
and liabilities denominated in Australian dollar to
Singapore dollar,
- a decrease of $0.9 million in government grants; and
- an increase of $3.7 million in loss allowance provided
for amount due from an associated company,
during FY2023.
Administrative Expenses
Administrative expenses increased by $6.3 million or 50.7% from $12.4 million for FY2022 to $18.7 million for FY2023. The increase was largely due to:
- an increase of $1.0 million in employee compensation
due to salary adjustment and higher provision for
bonus;
- an increase of $8.4 million in directors' remuneration
(including profit sharing) accrued, reflecting the
higher profit generated by the Group; and
- a $0.3 million increase in donation, $0.1 million increase
in repair and maintenance of office equipment, and
$0.1 million increase in withholding tax,
which were partially offset by the decrease of $3.6 million in professional fees in FY2023.
Finance Expenses
Finance expenses increased by $0.5 million or 31.6%, from $1.6 million in FY2022 to $2.1 million in FY2023. The increase was due mainly to higher borrowing costs arising from the increase in interest rates during FY2023.
Share of Results of Associated Companies And Joint Ventures

The share of results of associated companies and joint ventures decreased by $0.5 million or 71.3% from $0.7 million in FY2022 to $0.2 million in FY2023. The decrease was due mainly to the decrease in share of profit from the 22.5%-held associated company, Chong Kuo Development Pte Ltd, during FY2023.
Profit Before Income Tax
Profit before income tax increased by $50.6 million from $0.5 million in FY2022 to $51.1 million in FY2023. The increase was due mainly to (1) the increase in gross profit of $13.9 million and (2) the increase in other gains of $43.9 million, which were partially offset by, (3) the increase of $6.2 million in administrative expenses, (4) the increase in finance expenses of $0.5 million, and (5) the decrease in share of profit of $0.5 million, as explained above.
Income Tax Expense
Income tax expense increased by $3.3 million or 879.5% from $0.4 million in FY2022 to $3.7 million in FY2023, primarily driven by the Group's higher taxable profit, attributed to the arbitral award received in relation to the 2017 worksite accident and operational profit derived from both ongoing and newly awarded projects.
The effective tax rates for FY2023 and FY2022 stood at 7.2% and 69.6%, respectively.
The effective tax rate for FY2023 was 7.2%, which was lower than the statutory tax rate of 17%, due to the utilisation of tax credits. Conversely, the effective tax rate for FY2022 was higher than the statutory tax rate of 17.0% due mainly to (1) the relatively higher corporate tax rate of our Australian subsidiary corporation, (2) certain non-deductible items added back for tax purposes and (3) recognition of deferred tax liabilities in one of the subsidiary corporations.
Non-Controlling Interests
Non-controlling interests of $2.8 million was due to the share of profit of our subsidiary corporation, Raffles Prestige Capital Pte Ltd, in FY2023.
Net Profit
Overall, net profit increased by $47.2 million, from $0.2 million for FY2022 to $47.4 million for FY2023, following the increase in profit before income tax, which was partially offset by the increase in income tax expense, as explained above.
Our net profit margin increased from 0.1% for FY2022 to 29.6% for FY2023.
Balance Sheet
Current Assets
Current assets increased by $53.6 million, from $69.5 million as at 31 December 2022 to $123.1 million as at 31 December 2023. The substantial increase was primarily driven by:
- a $61.6 million boost in cash and cash equivalents,
mainly due to $75.2 million generated from
operating activities, an increase of $0.7 million in
pledged deposits, alongside $2.3 million in cash
used in investing activities and $12.0 million in
cash used in financing activities; and
- an increase in contract assets of $3.3 million, due
to an increase in construction contract receivable
from customers, arising from higher unbilled
amounts expected to be collected from customers
following the higher revenue,
- a decrease of $0.6 million in inventories, attributed
to the utilisation of materials for ongoing
construction and maintenance projects; and
- a decrease of $10.7 million in trade and other
receivables, as a result of timely collection of debts
throughout the financial period and the reversal of
previously paid deposits for arbitration,
during FY2023.
Non-current assets
Non-current assets increased by $1.0 million, from $135.4 million as at 31 December 2022 to $136.4 million as at 31 December 2023. The increase was due mainly to:
- an increase of $0.5 million in investments in
associated companies, driven by share of profit
and recognition of notional fair value of a loan
from an associated company;
- an increase in investment properties due to fair
value gain of $4.7 million;
- an increase of $2.8 million in right-of-use
assets, resulting from the purchase of plant
and equipment to support new and ongoing
projects through hire purchase, along with the
reclassification of certain plant and machinery
from property, plant and equipment; and
- an increase in deferred income tax assets of $0.5
million arising from the recognition of deferred
income tax assets in one of the subsidiary
corporations,
which was partially offset by: - a decrease in property, plant and equipment
of $0.6 million, mainly attributable to the
disposal and depreciation of property, plant and
equipment, coupled with reclassification of certain
plant and machinery to right-of-use assets; and
- a decrease of $6.9 million in other receivables, due
to $3.4 million loan repayment from an associated
company, Chong Kuo Development Pte Ltd,
additional impairment losses of $4.2 million and
a notional fair value adjustment of $0.3 million.
The decrease was partially offset by a $1.0 million
advance extended to USB Holdings Pte Ltd,
during FY2023.
Current liabilities
Current liabilities increased by $11.0 million, from $44.1 million as at 31 December 2022 to $55.1 million as at 31 December 2023. The increase was due mainly to:
- an increase of $11.7 million in trade and other
payables, attributable to $3.7 million increase
in trade payables, advances amounting to $1.0
million extended by non-controlling interest, and
an increase of $7.0 million in accruals due to the
provision of bonus and profit sharing for directors;
- an increase of $0.3 million in lease liabilities,
resulting from the purchase of plant and
machineries for newly awarded projects, mitigated
by repayment of lease liabilities; and
- an increase in current income tax liabilities by $2.8
million due to higher tax provision allocated for
profitable entities within the Group,
which was partially offset by: - a reduction of $3.8 million in bank borrowings, as a
result of the repayment of existing borrowings,
during FY2023.
Non-Current Liabilities
Non-current liabilities decreased by $2.1 million, from $37.0 million as at 31 December 2022 to $34.9 million as at 31 December 2023. The decrease was due mainly to:
- a decrease in other payables of $1.8 million, attributed to a notional fair value adjustment related to amount due to a non-controlling shareholder; and
- principal repayment of bank borrowings totalling $1.1 million,
- an increase of $0.8 million in deferred income tax
liabilities,
which were partially offset by:
during FY2023.
Shareholders' Equity
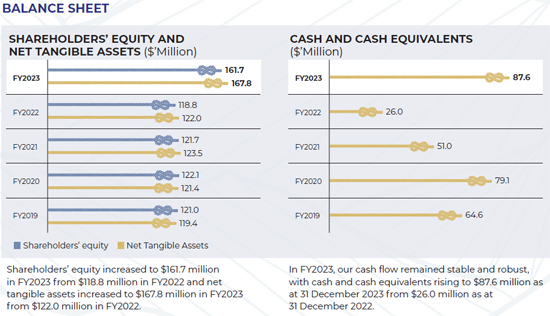
Shareholders' equity, comprising share capital, treasury shares, other reserves, retained profits and non-controlling interests, increased by $45.8 million, from $123.7 million as at 31 December 2022 to $169.5 million as at 31 December 2023. The increase was primarily driven by:
- an increase of $2.0 million in capital reserve; and
- profits generated from operations amounting
to $44.6 million attributable to equity holders of
the Company, along with $2.8 million in profits
attributable to non-controlling interests from the
share of profit of Raffles Prestige Capital Pte Ltd,
which were partially offset by: - dividend payment to shareholders of $3.6 million,
during FY2023.
Our Operating And Financial Review




Corporate Liquidity And Cash Resources

We maintain a healthy balance sheet and cash flow position which enable us to explore new infrastructure projects and property investments, either here or overseas.
We reported net cash generation of $75.2 million from operating activities in FY2023, marking a significant increase of $81.8 million compared to net cash usage of $6.6 million in FY2022. The increase was largely attributable to:
- an increase in cash generated from operating activities before working capital changes, amounting to $50.5 million;
- an increase in net working capital inflow of $29.7 million;
- an increase in interest received totalling $1.2 million; and
- a decrease in income tax payments of $0.4 million,
Net cash used in investing activities decreased by $7.4 million from $9.7 million in FY2022 to $2.3 million in FY2023. The decrease was due mainly to:
- a loan repayment of $3.4 million received from an
associated company;
- a decrease of $1.1 million in advances extended to an
associated company;
- a decrease of $1.0 million in cash used for the
purchase of property, plant and equipment; and
- a decrease of $2.0 million in cash used for other
investment at amortised cost,
- an increase of $0.1 million in cash used for the purchase
of right-of-use assets,
Net cash used in financing activities increased by $3.4 million, from $8.6 million in FY2022 to $12.0 million in FY2023. The increase was due mainly to:
- an increase of $0.5 million in repayment of lease
liabilities;
- an increase of $0.5 million in interest payments;
- an increase of $0.9 million in repayment of borrowings;
- an increase of $1.6 million in dividend disbursements;
and
- a reduction of $0.7 million in pledged bank deposits,
- an increase of $0.8 million in advance from a noncontrolling
shareholder,
Overall, free cash and cash equivalents stood at $81.7 million as at 31 December 2023, demonstrating a notable increase of $60.9 million from $20.8 million as at 31 December 2022. This signifies cash reserves of 26.6 cents per share as at 31 December 2023, a marked increase from the 6.7 cents per share recorded as at 31 December 2022 (based on 306,961,494 issued shares).


The finance lease liabilities of $7.9 million (FY2022: $7.7 million) are secured by way of corporate guarantees issued by the Company and charges over the property, plant and equipment under the leases.
The bank borrowings of $24.1 million (FY2022: $29.0 million) is secured by first legal mortgage over an investment property of the Group, certain bank deposits, the Group's shares in a subsidiary corporation and corporate guarantee of the Company.
The decrease in debt amount from $36.7 million as at FY2022 to $32.0 million as at FY2023 as a result of repayment of lease labilities and bank borrowings during FY2023.

Value Added Statement

Total value-added created by the Group in FY2023 amounted to $109.3 million (2022: $44.3 million) due to higher profits reported in FY2022.
In FY2023, about $48.1 million or 44.0 per cent of the value-added was paid to employees in the form of salaries and wages. $4.0 million or 4.0 per cent was paid to the government in the form of corporate and property taxes while $5.3 million or 5.0 per cent was paid as dividends and interests to financial institutions. Balance of $52.6 million was retained by the Group for its future growth.
In FY2022, about $37.4 million or 85.0 per cent of the value-added was paid to employees in the form of salaries and wages. $0.5 million or 1.0 per cent was paid to the government in the form of corporate and property taxes while $3.3 million or 7.0 per cent was paid as dividends and interests to financial institutions. Balance of $4.8 million was retained by the Group for its future growth.


